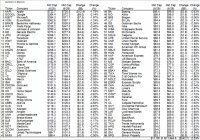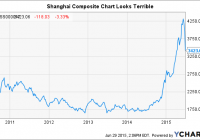
Summary Brief overview of the series which began April 30, 2014. The Perfect Storm! Two potential trigger events happening simultaneously. Current buy prices on some of my preferred put options for hedging. Discussion of the risks inherent to this strategy versus not being hedged. Back to May 2015 Update Strategy Overview The May record highs held for June and major domestic indices appear ready to end the month of June lower. Stocks are lower as I write this (Sunday, June 29, 2015) but some of the option prices are still lower than a month ago, in many cases, and provide better entry points for those who are not already fully hedged. I am completely hedged already for the remainder of 2015. The top of this bull market may not be in yet, but it should certainly be close enough to lock in the insurance needed to protect against a recession, if one comes by year end. If you are new to this series you will likely find it useful to refer back to the original articles, all of which are listed with links in this Instablog . In the Part I of this series I provided an overview of a strategy to protect an equity portfolio from heavy losses in a market crash. In Part II, I provided more explanation of how the strategy works and gave the first two candidate companies to choose from as part of a diversified basket using put option contracts. I also provided an explanation of the candidate selection process and an example of how it can help grow both capital and income over the long term. Part III provided a basic tutorial on options. Part IV explained my process for selecting options and Part V explained why I do not use ETFs for hedging. Parts VI through IX primarily provide additional candidates for use in the strategy. Part X explains my rules that guide my exit strategy. All of the above articles include varying views that I consider to be worthy of contemplation regarding possible triggers that could lead to another sizeable market correction. Part II of the December 2014 update explains how I have rolled my positions. I want to make it very clear that I am not predicting a market crash. I like being more cautious at these lofty levels. Bear markets are a part of investing in equities, plain and simple. I like to take some of the pain out of the downside to make it easier to stick to my investing plan: select superior companies that have sustainable advantages, consistently rising dividends and excellent long-term growth prospects. Then I like to hold onto to those investments unless the fundamental reasons for which I bought them in the first place changes. Investing long term works! I just want to reduce the occasional pain inflicted by bear markets. A note specifically to those who think that I am trying to “time the market” or who believe that I am throwing money away with this strategy. I am perfectly comfortable to keep spending 1.5 percent of my portfolio per year for five years, if that is what it takes. Over that five year period I will have paid a total insurance premium of as much as 7.5 percent of my portfolio (approximately 1.5 percent per year average). If it takes five years beyond the point at which I began, so be it. The concept of insuring the exposure to risk is not a new concept. If I have to spend 7.5 percent over five years in order to avoid a loss of 30 percent or more I am perfectly comfortable with that. I view insurance, like hedging, as a necessary evil to avoid significant financial setbacks. From my point of view, those who do not hedge are trying to time the market. They intend to sell when the market turns but always buy the dips. While buying the dips is a sound strategy, it does not work well when the “dip” evolves into a full blown bear market. At that point the eternal bull finds himself catching the proverbial rain of falling knives as his/her portfolio tanks. Then panic sets in and the typical investor sells after they have already lost 25 percent or more of the value of their portfolio. This is one of the primary reasons why the typical retail investor underperforms the index. He/she is always trying to time the market. I, too, buy quality stocks on the dips, but I hold for the long term and hedge against disaster with my inexpensive hedging strategy. I hope that this explanation helps clarify the difference between timing the market and a long-term, buy-and-hold position with a hedging strategy appropriately used only at the high end of a near-record bull market. The Perfect Storm? By the time this article is published the situation in Europe with Greece about to default (yet again) on debt will be all over the news. Greek banks are to be closed for the remainder of the week, ATM withdrawals are limited, the stock exchange is closed, and Western Union has closed its Greek operations for the week, among other items that the media may or may not choose to report. But it is not the debt owed by Greece to the IMF, ECB or other member nations of the EZ that concerns me. The part that concerns me most about the Greek situation is that tangled webs of over-the-counter derivatives that are held by major financial institutions around the globe. How many of these securities contain slices of Greek debt? Who is ultimate counterparty? In 2008, Lehman was taken down by this problem. Governments around the globe announced that the problem would be fixed so such instruments would not pose a problem for the global financial markets in the future. At first, the amount of such securities began to shrink. But then, wouldn’t you know it, financial institutions decided that the risk was not enough to give up the profits available. As evidence, the size of outstanding OTC derivative securities is larger today ($630 trillion at year-end 2014) than it was before the financial crisis in 2007 ($516 trillion). Those numbers are the notional values and actual “real” values are only $11 trillion in 2007 and $20 trillion at the end of 2014. Considering the much smaller real values this is obviously not a big problem (sarcasm). The other thing about Greece that concerns me is what a crisis in Europe could do to the borrowing rates of Portugal, Spain, Ireland and Italy. Those economies are not running on all cylinders either and a significant increase in borrowing costs could put them on a path similar to Greece. And, of course, we run into the derivatives complexities again if the situation changes for the worse in any of these countries as well. But that is another problem for another day. Today, the problem is Greece. But Greece is not the only problem on the global scene. Chinese equities markets on the mainland are getting hammered! First, real estate was the way to make millions in China; lately A shares on the Shanghai and Shenzhen exchanges were going up and making anyone with a little money rich. But now stocks are down by about 20 percent in June . ^SS000017 data by YCharts ^SS399106 data by YCharts I do not see the bottom formation developing here, do you? The miracle that propelled this bull run was margin leverage according to this link from Bloomberg . Will additional selling to meet margin calls force further deterioration? That would be a good bet. Will this turn into an outright crash? If it does, will it spill over into other markets? I do not have the answers to those questions. I am hedged, so the answers are irrelevant to me. My point here is simple: Can the global financial markets withstand two potential crises simultaneously? I do not know the answer but find this to be a good reason to consider caution. With the current bull market having run more than 70 months, it is now more than double the average duration (30.7 months) of all bull markets since 1929. The current bull is now longer in duration than all but three bull markets during that time period (out of a total of 15). So, I am preparing for the inevitable next bear market. I do not know when the strategy will pay off, and I will be the first to admit that I am probably earlier than I suggested at the beginning of this series. However, I do feel confident that the probability of experiencing another major bear market will rise in the coming year(s). It may be 2015, 2016 or even 2017, before we take another hit like we did in 2000-2002 or 2008-09. But I am not willing to risk watching 50 percent (or more) of my portfolio evaporate to save the less than two percent per year cost of a rolling insurance hedge. I am convinced that the longer the duration of the bull market lasts the worse the resulting bear market will be. I continue to base my expected hedge position returns on a market swoon of 30 percent, but now believe that the slide could be much worse as this bull continues to outlive its ancestry. You may disagree with my assessment of the potential severity of the next recession and the impact it will wreak on equities; none of us knows with certainty what the outcome will be or when it will happen. It is very conceivable that we could experience a mild correction, followed by a strong bounce, before the really big bad bear shows itself. But there is one thing we all do know: eventually it will come. I will be prepared. Will you? Current Premiums on select Candidates In this section I will provide current quotes and other data points on selected candidates that pose an improved entry point from the last update. All quotes and information are based upon the close on Friday, June 26, 2015. I am calculating the possible gain percentage, total estimated dollar amount of hedge protection (Tot Est. $ Hedge) and the percent cost of portfolio using the “ask” premium. You should be able to do better than the listed premium unless the share price of the listed stock has fallen significantly between last Friday and the time you read this article. I suggest that, if you decide to buy puts to employ this strategy, you should place limit orders only at about the midpoint between the most recent bid and ask prices listed. You may need to adjust your bid slightly higher if you do not get a fill, but a few pennies does not ruin the return potential on the listed option contracts. I try to buy on days when the market is either making new highs or nearing those levels and on a day when the market in general is heading higher. Please remember that all calculations of the percent cost of portfolio are based upon a $100,000 equity portfolio. If you have an equity portfolio of $400,000 you will need to increase the number of contracts by a factor of four to gain adequate coverage. Also, the hedge amount provided is predicated upon a 30 percent drop in equities during an economic recession and owning eight hedge positions that provide protection that approximates $30,000 for each $100,000 of equities. So, you should pick eight candidates from the list and make sure that the hedge amounts total to about $30,000 (for each $100,000 value in your stock portfolio). Since each option represents 100 shares of the underlying stock, we cannot be extremely precise, but we can get very close. If the market drops by more than 30 percent I expect that to do better than merely protect my portfolio because these stocks are very likely to fall further and faster than the overall market, especially in a crash. Another precaution: do not try to use this hedge strategy for the fixed income portion of your portfolio. If the total value of your portfolio is $400,000, but $100,000 of that is in bonds or preferred stocks, use this strategy to hedge against the remaining $300,000 of stocks held in the portfolio (assuming that stock is all that is left). This is also not meant to hedge against other assets such as real estate, collectibles or precious metals. Finally, the companies are not listed in the order of my preference. I will provide that information at the bottom of the list. If you want a more detailed explanation of why I expect these particular stocks to fall more than the broad market, please refer to the earlier articles in this series which can be found at this link . If you disagree with my expectations for any of the stocks listed, please feel free to mix and match or use some others with which you feel more comfortable. Just make sure that the stocks you use are likely to be ravaged more by a recession than the average company. Goodyear Tire & Rubber (NASDAQ: GT ) Current Price Target Price Strike Price Bid Premium Ask Premium Poss. % Gain Tot Est. $ Hedge % Cost of Portfolio $31.40 $8.00 $22.00 $0.20 $0.30 4567 $4,110 0.09% I suspect that we are getting close to the peak of the new car sales cycle. While there have not been a lot of generational cycles since autos became part of the American dream, the peaks of the past have generally occurred when the bulk of prior generations were early 50s in age. The baby boom generation saw its majority turn 53 last year. That is not to saw that history will repeat exactly, but rather that as people age and retire, we drive less and buy cars less often. If the trend holds true this time, new car sales may begin to fall in coming years and that will put a dent in the OEM market for GT. I would need three January 2016 GT put option contracts to cover approximately one eighth of a $100,000 equity portfolio. If you already own a full position of GT options, do not exchange those for the new position. This would only add to your cost by increasing transactions. This new position is for anyone who has not yet completed their position or who may be rolling over to replace a July position. This statement applies to all of the “new” positions listed in this article. Do not trade in and out of positions to try to improve your overall position. That just defeats the purpose of keeping this strategy affordable. A better strategy is to average into a position over time, lowering your average cost basis with each purchase. Williams-Sonoma (NYSE: WSM ) Current Price Target Price Strike Price Bid Premium Ask Premium Poss. % Gain Tot Est. $ Hedge % Cost of Portfolio $82.98 $24.00 $70.00 $1.55 $1.90 2321 $4,410 0.190% I need only one January 2016 WSM put option contract to provide the indicated loss coverage for each $100,000 in portfolio value. I raised the target price for WSM from $20 to $24 to account for the price increase of WSM stock. CarMax (NYSE: KMX ) Current Price Target Price Strike Price Bid Premium Ask Premium Poss. % Gain Tot Est. $ Hedge % Cost of Portfolio $68.41 $16.00 $57.50 $1.50 $1.80 2206 $3,970 0.180% I will need only one January 2016 KMX put options with a strike of $57.50 to complete this position for each $100,000 in portfolio value. The strike increases from last month but the cost is the same. Royal Caribbean Cruises (NYSE: RCL ) Current Price Target Price Strike Price Bid Premium Ask Premium Poss. % Gain Tot Est. $ Hedge % Cost of Portfolio $79.80 $22.00 $62.50 $1.33 $1.45 2693 $3,905 0.145% I need one January 2016 RCL put option contract to provide the indicated loss coverage for each $100,000 in portfolio value. RCL stock price has risen again since the last update but I am leaving the target price alone while moving the strike price up achieving better coverage at only a small increase in cost. When the next recession hits and the layoffs begin to mount, vacation plans get canceled. L Brands (NYSE: LB ) Current Price Target Price Strike Price Bid Premium Ask Premium Poss. % Gain Tot Est. $ Hedge % Cost of Portfolio $88.06 $30.00 $72.00 $1.25 $1.45 2797 $4,055 0.145% I need only one January 2016 LB put option to provide the indicated loss coverage for each $100,000 in portfolio value. I am raising the strike price even though the premiums are lower than last month. Both the cost and the coverage improved since last month. When a recession hits, household budgets get cut. Marriott International (NASDAQ: MAR ) Current Price Target Price Strike Price Bid Premium Ask Premium Poss. % Gain Tot Est. $ Hedge % Cost of Portfolio $76.02 $30.00 $65.00 $1.55 $1.75 1900 $3,325 0.175% I need one January 2016 MAR put option contract to provide the indicated loss coverage for each $100,000 in portfolio value. The price of MAR stock is down for the second straight month but I am still able to increase the strike price from $50 to $65 for better coverage while keeping the cost profile reasonable. As I have stated before, travel will suffer in a recession and MAR profits will be a victim due to lower occupancy rates, especially from business travel. Micron Technology (NASDAQ: MU ) Current Price Target Price Strike Price Bid Premium Ask Premium Poss. % Gain Tot Est. $ Hedge % Cost of Portfolio $19.66 $10.00 $15.00 $0.41 $0.47 964 $3,624 0.376% I need eight January 2016 MU put option contracts to provide the indicated loss coverage for each $100,000 in portfolio value. The MU stock price has fallen substantially from $27.32 since my update last month. I am dropping the strike price to $15 from $18 for any new positions being considered in order to keep the costs from going too high. If there is a recession or stock crash this recent drop is only just the beginning so we want to hold onto our MU positions. Do not take profits yet. We are still very early in this move. E*Trade Financial (NASDAQ: ETFC ) Current Price Target Price Strike Price Bid Premium Ask Premium Poss. % Gain Tot Est. $ Hedge % Cost of Portfolio $30.72 $7.00 $25.00 $0.74 $0.84 2018 $3,430 0.170% The position shown above would require two January 2016 ETFC put option contracts to provide the indicated loss coverage for each $100,000 in portfolio value. I am raising the strike price again for better coverage while also lowering the average cost. When the market crashes many investors freeze up and transaction volumes suffer. ETFC has a history of going into the tank when the economy slows significantly. United Continental (NYSE: UAL ) Current Price Target Price Strike Price Bid Premium Ask Premium Poss. % Gain Tot Est. $ Hedge % Cost of Portfolio $54.48 $18.00 $37.00 $0.65 $0.81 2246 $3,648 0.162% I need two January 2016 UAL put contracts to provide the indicated loss coverage for each $100,000 in portfolio value. Fuel costs are a large part of airline budgets and volatility in fuel prices has led to volatility in the UAL stock price. But during a recession fuel costs will not determine airline profitability, capacity utilization will. During a recession carriers tend to lose customers as businesses and individuals cut travel budgets, especially air travel. Only so many flights can be cut or delayed before customers become less loyal. UAL has a way of maddening customers when it is trying to fill planes. I have personal experience and have witnessed scores of other customers with rage in their eyes at UAL customer service. This is not personal. It is just about customer service and UAL, in my experience, is prone to drop the ball in this area. It gets worse in a recession. Morgan Stanley (NYSE: MS ) Current Price Target Price Strike Price Bid Premium Ask Premium Poss. % Gain Tot Est. $ Hedge % Cost of Portfolio $39.50 $15.00 $34.00 $0.87 $0.92 1965 $3,616 0.184% I need two January 2016 MS put contracts to provide the indicated loss coverage for each $100,000 in portfolio value. I am raising the strike on MS again because we are able to improve coverage significantly at a reasonable cost. You may have noticed that this is a recurring theme in this update. The reason that the cost is coming down to make higher strike prices available to us is the time decay factor. Waiting sometime pays off until it doesn’t. I wouldn’t wait much longer if you have not yet hedged. Seagate Technologies (NASDAQ: STX ) Current Price Target Price Strike Price Bid Premium Ask Premium Poss. % Gain Tot Est. $ Hedge % Cost of Portfolio $50.06 $24.00 $35.00 $0.47 $0.52 2015 $4,192 0.208% I need four January 2016 STX put contracts to provide the indicated loss coverage for each $100,000 in portfolio value. This stock has fallen since my article last month so we are able to retain the same strike, but at a slightly higher cost. STX has taken a beating in the last two recessions. I see no reason to expect a different outcome this time. Sotheby’s (NYSE: BID ) Current Price Target Price Strike Price Bid Premium Ask Premium Poss. % Gain Tot Est. $ Hedge % Cost of Portfolio $46.71 $16.00 $35.00 $0.40 $0.50 3700 $3,700 0.101% I need two January 2016 BID put contracts to provide the indicated loss coverage for each $100,000 in portfolio value. BID stock has risen by about $2.00 since the last report so I was able to keep the same strike for a lower premium. BID is a China success story. China has multiple potential triggers that could undermine growth there. The newly wealthy will stop bidding prices of collectibles into the stratosphere when that wealth takes a significant hit. As mentioned earlier in the article, that hit to wealth may be taking place as you read this; it just depends on how far Chinese markets continue to fall. Jabil Circuits (NYSE: JBL ) Current Price Target Price Strike Price Bid Premium Ask Premium Poss. % Gain Tot Est. $ Hedge % Cost of Portfolio $21.98 $10.00 $16.00 $0.05 $0.20 2400 $3,840 0.160% I need eight January 2016 JBL put contracts to provide the indicated loss coverage for each $100,000 in portfolio value. The price of JBL stock has fallen over ten percent since my last update. In response, I have lowered the strike price to keep the cost profile low. Hang on, this stock will tumble in a recession. Tempur Pedic (NYSE: TPX ) Current Price Target Price Strike Price Bid Premium Ask Premium Poss. % Gain Tot Est. $ Hedge % Cost of Portfolio $67.18 $20.00 $50.00 $1.00 $1.45 1969 $2,855 0.145% I need one January 2016 TPX put contract to provide the indicated loss coverage for each $100,000 in portfolio value. I raised the strike price to $50 from $35 to account for the most recent run up in share price. New furniture sales fall precipitously during a recession as household formation slows and upgrades get delayed. Level 3 Communications (NYSE: LVLT ) Current Price Target Price Strike Price Bid Premium Ask Premium Poss. % Gain Tot Est. $ Hedge % Cost of Portfolio $53.79 $20.00 $42.00 $0.60 $0.90 2344 $4,220 0.180% I need two January 2016 LVLT put contracts to provide the indicated loss coverage for each $100,000 in portfolio value. Not much change since the last update. This company has had a habit of imitating a rock in water during the last two recessions. The business model has changed but the perceptions of institutional investors is what will drive this stock. Perception usually takes longer to change. Veeco Instruments (NASDAQ: VECO ) Current Price Target Price Strike Price Bid Premium Ask Premium Poss. % Gain Tot Est. $ Hedge % Cost of Portfolio $29.81 $12.00 $20.00 $0.20 $0.40 1900 $3,800 0.200% VECO options have become less expensive since the last update and the stock has already exhibited weakness as the company posts losses even in a “growing” economy. A recession would hit this stock hard. I will need five January 2016 VECO put option contracts to provide the indicated loss coverage for each $100,000 in portfolio value. The option costs of the following companies are currently too high to be considered at this time: Terex (NYSE: TEX ) and USG (NYSE: USG ). If the situation changes I will include the candidate in a future update. Summary My top eight choices at this time, in the order of my preference, are UAL, MU, STX, VECO, LB, MAR, JBL, and KMX. That group (using the put option contracts suggested above) should provide approximately $30,444 in downside protection against a 30 percent market correction at a cost of 1.606 percent of a $100,000 portfolio. Overall, my average cost to hedge this year is less than to 1.5 percent of my equity portfolio. If you want to employ this strategy but do not like using one or more of these eight candidates for a hedge position, please feel free to choose from the other eight or pick some of your own. The order of my preference from the remainder of the list is: RCL, WSM, MS, LVLT, GT, BID, ETFC and TPX. The primary reason I like the candidates listed as my favorite eight has to do with the technical assessment of their charts. These eight appear the weakest of the bunch and more likely to break down first in the event of a recession in coming months. I no longer wish to add any new positions with an expiration before January 2016 because if a recession should hit in 2015 the ensuing bear market in equities could last several months or even more than a year so the shorter term positions no longer provide adequate protection. If you already own some of the shorter term positions please consider replacing them with positions with a January 2016 expiration. When I say that I replace the short-term positions with the January positions I mean that I sell those positions if economical (receive more than the transaction costs). I use the proceeds from the sale to purchase new positions. If the options are nearly worthless, I wait for a market correction (even a minor one) to cash them in. Otherwise, with no correction I allow them to expire. None of the candidates listed in this article will need to be replaced until next January thereby keeping the cost below two percent for nearly a year. Brief Discussion of Risks If an investor decides to employ this hedge strategy, each individual needs to do some additional due diligence to identify which candidates they wish to use and which contracts are best suited for their respective risk tolerance. I do not always choose the option contract with the highest possible gain or the lowest cost. I should also point out that in many cases I will own several different contracts with different strikes on one company. I do so because as the strike rises the hedge kicks in sooner, but I buy a mix to keep the overall cost down. My goal is to commit approximately two percent (but up to three percent, if necessary) of my portfolio value to this hedge per year. If we need to roll positions before expiration there will be additional costs involved, so I try to hold down costs for each round that is necessary. I do not expect to need to roll positions more than once, if that, before we see the benefit of this strategy work. I want to discuss risk for a moment now. Obviously, if the market continues higher beyond January 2016 all of our new option contracts could expire worthless. I have never found insurance offered for free. We could lose all of our initial premiums paid plus commissions. If I expected that to happen I would not be using the strategy myself. But it is one of the potential outcomes and readers should be aware of it. And if that happens, I will initiate another round of put options for expiration beyond January 2016, using from up to three percent of my portfolio to hedge for another year. The longer the bull maintains control of the market the more the insurance will cost me. But I will not be worrying about the next crash. Peace of mind has a cost. I just like to keep it as low as possible. Because of the uncertainty in terms of how much longer this bull market can be sustained and the potential risk versus reward potential of hedging versus not hedging, it is my preference to risk a small percentage of my principal (perhaps as much as three percent per year) to insure against losing a much larger portion of my capital (30 to 50 percent). But this is a decision that each investor needs to make for themselves. I do not commit more than five percent of my portfolio value to an initial hedge strategy position and have never committed more than ten percent to such a strategy in total before a major market downturn has occurred. The ten percent rule may come into play when a bull market continues much longer than expected (like three years instead of 18 months). And when the bull continues for longer than is supported by the fundamentals, the bear that follows is usually deeper than it otherwise would have been. In other words, I expect a much less powerful bear market if one begins early in 2015; but if the bull can sustain itself into late 2015 or beyond, I would expect the next bear market to be more like the last two. If I am right, protecting a portfolio becomes ever more important as the bull market continues. As always, I welcome comments and will try to address any concerns or questions either in the comments section or in a future article as soon as I can. The great thing about Seeking Alpha is that we can agree to disagree and, through respectful discussion, learn from each other’s experience and knowledge. Disclosure: I/we have no positions in any stocks mentioned, and no plans to initiate any positions within the next 72 hours. (More…) I wrote this article myself, and it expresses my own opinions. I am not receiving compensation for it (other than from Seeking Alpha). I have no business relationship with any company whose stock is mentioned in this article. Additional disclosure: I hold put options on all of the stocks mentioned in this article.