Tag Archives: setpageviewname

Sector Factors To Consider With Dividend ETFs

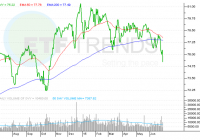
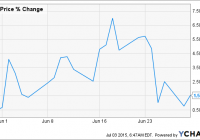
Summary Dividend stock ETFs have been losing assets as Treasuries sold off and yields rose. The selling pressure in dividends provides a warning for what could occur in a rising rate environment. A good chunk of dividend ETF portfolios are allocated in utility stocks, which are sensitive to changes in interest rates. By Todd Shriber & Tom Lydon Thanks to the jump in Treasury yields, a rise that has been fueled by speculation the Federal Reserve will soon raise interest rates, investors are departing some noteworthy dividend exchange traded funds. Of the four largest dividend ETFs, only the Vanguard High Dividend Yield ETF (NYSEArca: VYM ) has seen inflows this year, while the iShares Select Dividend ETF (NYSEArca: DVY ) is the worst outflows offender of the four due in part to its 31.5% weight to the lagging utilities sector. Once the Federal Reserve hikes interest rates, U.S. dividend stocks and exchange traded funds could experience a meaningful correction after investors piled into the yield-paying assets during the low rate environment. That is particularly true of dividend ETFs with big weights to rate-sensitive utilities and real estate stocks. Reports Chris Dieterich for Barron’s : Part of the concern: All that money that’s flowed in over the past six years could be yanked out just as quickly, as investors scramble to take profits at the first whiff of market trouble. That’s happened twice over the past two years, first in 2013 and again in the past few months, when the stocks that have fallen hardest were those with the highest yields. Take utilities, the highest yielders among the S&P 500’s 10 industry groups. Utility stocks on the S&P 500 are fresh off a 6.7% plunge in the second quarter, the worst of any U.S. stock sector, while the S&P 500 overall was flat. With Treasury yields climbing, utilities-heavy dividend ETFs are lagging. For example, DVY is off nearly 3% this year while the S&P 500 is up 1.8%. The First Trust Value Line Dividend Index Fund (NYSEArca: FVD ) has lost 1.2% thanks to an almost 23.75 weight to utilities stocks, indicating investors have mistakenly added over $118 million to that ETF this year. On the bright side, recent history shows dividend ETFs can whether the rising Treasury yields storm. That happened in 2013 when Treasury yields surged, but DVY and FVD gained an average of 27.8%, though that lagged the 32.3% returned by the S&P 500. The caveat with 2013 is that the Utilities Select Sector SPDR (NYSEArca: XLU ) gained more than 10%, a feat unlikely to be repeated this year. DVY remains alluring for income ETFs , in part due to a screening methodology that includes dividend growth and payout ratios. However, stock selection by yield could make DVY vulnerable to increased lethargy if Treasury yields continue higher. FVD follows the Value Line Dividend Index, which equally weights components and utilizes the proprietary Value Line research to select components. Specifically, stocks are ranked by the Value Line Safety Ranking of 1 or 2 out of 5, which are based on price stability and financial strength. Additionally, the index excludes stocks with a dividend yield lower than the S&P 500. iShares Select Dividend ETF (click to enlarge) Tom Lydon’s clients own shares of DVY. Disclosure: I am/we are long DVY. (More…) I wrote this article myself, and it expresses my own opinions. I am not receiving compensation for it. I have no business relationship with any company whose stock is mentioned in this article.

EWZ: June Review

Summary The iShares MSCI Brazil Capped ETF grew by 1.55% in June. Out of the 15 biggest EWZ holdings, Cielo was the biggest gainer and Vale was the biggest looser. The Petrobras corruption scandal still impacts Brazilian share markets significantly. The iShares MSCI Brazil Capped ETF (NYSEARCA: EWZ ) grew by 1.55% in June. Although the first half of the month was very good and EWZ’s share price was up by 7% at one point, it started to decline in the second half of June, as the Petrobras (NYSE: PBR ) corruption scandal started to weigh on Brazilian share markets again. On June 19, Reuters reported that police arrested top executives of the two biggest Brazilian construction companies. And on June 25, a wave of panic flooded the markets, as a rumor claimed that the former Brazilian president da Silva should be investigated. Although the rumor was denied quickly, the panic reactions have demonstrated that investors are still extremely sensitive to any news related to the corruption scandal that is still far from over. The portfolio of EWZ consists of 68 share titles. The 15 largest holdings represent more than 60% of assets of the fund. The biggest holdings are prefferred shares of Itau Unibanco (NYSE: ITUB ), the biggest Brazilian bank, followed by shares of Ambev (NYSE: ABEV ), a major South American beer and soft drinks producer. Ordinary shares of the second biggest Brazilian bank, Banco Bradesco (NYSE: BBD ), create 7.19% of the portfolio. And the weight of preferred shares of Petrobras is 5.06%. Source: Own processing, using data of iShares.com The chart below shows the June performance of the 15 biggest holdings. The biggest price increase experienced shares of electronic payment solutions company Cielo ( OTCQX:CIOXY ) (9.55%), shares of Banco do Brasil ( OTCPK:BDORY ) (6.77%) and shares of the stock exchange BMF Bovespa (4.36%). On the other hand, June wasn’t good for shares of the energy sector holding company Ultrapar (NYSE: UGP ) (-4.28%) and for diversified mining company Vale (NYSE: VALE ) (-7.04% and -8.78%). (click to enlarge) Source: Own processing, using data of Bloomberg The share price of Cielo grew by 9.55% in June. The growth was fueled by the announcement that Cielo will acquire 30% of Stelo S.A. The transaction should help Cielo, the biggest Brazilian electronic payment solution company, to expand to the electronic wallet segment. Shares of Vale were crushed by weak metals prices. The iron ore price started to grow after it bottomed in early April near the $46/tonne level and it reached $62/tonne in the first decade of June. But it started to decline again and it was at $55/tonne in late June. Copper price declined by 4% and Vale’s investors started to be nervous again. Not only the share price of Petrobras is negatively affected by the corruption scandal. Also the future growth prospects of the company are negatively affected. The company intends to cut its investments by 37% over the next five years. Petrobras plans to invest $130 billion over the 2015-2019 time period, although the original plan was to spend $207 billion. The company needs to reduce its huge debt, but this decision will reduce its growth significantly. (click to enlarge) Source: Own processing, using data of YahooFinance As shown by the chart above, the EWZ share price is strongly correlated with S&P 500 as well as with oil prices represented by The United States Oil ETF (NYSEARCA: USO ). But the strongest and most stable correlation is between EWZ and Petrobras. Although Petrobras represents only 9.03% of EWZ’s portfolio, it is one of the most important Brazilian companies and it has a strong impact on the whole Brazilian economy. Moreover the current corruption scandal leads to an increased political risk and any negative news about Petrobras tends to affect the whole Brazilian share market. The chart shows that EWZ had the highest correlation with Petrobras share price and S&P 500 in June. (click to enlarge) Source: Own processing, using data of YahooFinance The chart above shows volatility of EWZ measured by 10-day moving coefficient of variation. Although the volatility was high in late May and early June, it was relatively low and stable during the second part of the month. Conclusion The EWZ share price increased by 1.55% in June, when most of the early gains evaporated during the last decade, as the corruption scandal started to unnerve investors again. The moving correlation between EWZ and Petrobras was high and stable in late June. On the other hand the correlation between EWZ and S&P 500 was high and declining and correlation between EWZ and USO was high and growing. The development on global share markets, development of oil prices and any news related to the Petrobras corruption scandal will impact the direction of EWZ in July. Moreover the state of the Brazilian economy isn’t good, the GDP is expected to decline by 1-1.2% in 2015. Although EWZ may be an ineresting long term buy, it is quite probable that its share price will decline in the short term. Editor’s Note: This article discusses one or more securities that do not trade on a major U.S. exchange. Please be aware of the risks associated with these stocks. Disclosure: I am/we are long PBR. (More…) I wrote this article myself, and it expresses my own opinions. I am not receiving compensation for it (other than from Seeking Alpha). I have no business relationship with any company whose stock is mentioned in this article.

Trade Ideas To Make Money From The Strong U.S. Dollar – Idea 1

Summary A stronger U.S. Dollar will make USD denominated emerging market debt to become more expensive. As higher default risks get priced into sovereign bonds especially post the Greek debt default saga, a significant price decline could ensue. The slowing emerging market growths are not positive for emerging market debts. The U.S. Dollar has been on a tear since July 2014 and the knock-on effects of a significantly stronger U.S. Dollar have already been felt amongst the whole spectrum of commodities. With the U.S. Dollar having convincingly broken out a multi-year downward trendline (see chart below), it is quite apparent that we are only in the early stages of the USD bull market. The two main reasons which underpin my view are as follows: Divergence in monetary policy – As the U.S. intends to raise rates while the rest of the major economies are still easing, this will incentivise investors to hold more USD denominated assets. The global Carry Trade which is in the trillions of USD is likely to see a reversal as U.S. interest rates rise. This will cause the USD to get bid. Since the USD is still the world’s reserve currency and most transactions are denominated in USD, it goes without saying that this USD bull market will not only radically change the dynamics worldwide but this will undoubtedly also create exciting trading opportunities in a panoply of areas. This series will look at ideas in the following areas: Emerging Market Debt (Idea 1) Emerging Market Equity (Idea 2) – we’ll shortlist a few opportunities at the Emerging Markets Indices level and at the Individual Stocks level. The U.S. Equity Market (Idea 3) – we’ll shortlist a few opportunities at the Individual Stock level. Opportunities in the currency space (Idea 4) – we’ll shortlist a few currencies which still offer good risk/reward. (click to enlarge) The knock-on effects of the nascent USD bull market are many. Today, I’ll talk about one of the ways I intend to play the stronger USD. Before giving away my trade idea, let’s go back a few years in history. Ultra-low interest rates in the U.S. have allowed several countries mainly emerging economies to borrow cheaply in USD to invest in their local economies with the idea that local investments are going to yield much higher interest rates. Logic has it that if you borrow in USD, you need to pay back your loans in USD as well. With the USD significantly higher nowadays than when the loans were taken, the latter are undoubtedly getting more expensive to service. We can even go further and look at the slowing pace of GDP growth in emerging economies including China to deduce that the local investments are no longer yielding as high returns as they used to. TRADE IDEA Shorting emerging market government bonds denominated in USD is my way of playing out the dynamics I have outlined earlier. The iShares J.P. Morgan USD Emerging Markets Bond ETF (NYSEARCA: EMB ) provides a great way to structure this trade idea especially for retail traders and the non-professionals who might not have access to express their views on emerging market bonds. EMB is an ETF holding various Emerging Market bonds which are denominated in USD. EMB is therefore negatively-correlated to the U.S. Dollar as shown below: (click to enlarge) The top 10 holdings of EMB are as follows: Name Weight (%) Market Value Duration Notional Value RUSSIAN (FEDERATION OF) RegS 1.92 $105,401,168 4.25 105,401,167.71 ARGENTINA REPUBLIC OF 1.11 $60,941,923 7.93 60,941,923.07 PERU (REPUBLIC OF) 1.02 $56,204,117 10.64 56,204,116.84 POLAND (REPUBLIC OF) 1.02 $55,977,705 3.54 55,977,705.36 URUGUAY (ORIENTAL REPUBLIC OF) 1.02 $55,887,349 15.02 55,887,348.87 POLAND (REPUBLIC OF) 0.98 $53,632,120 5.71 53,632,120.47 PETRONAS CAPITAL LTD. RegS 0.92 $50,412,611 3.68 50,412,611.24 ROMANIA (REPUBLIC OF) MTN RegS 0.89 $48,771,815 5.34 48,771,814.69 HUNGARY (REPUBLIC OF) 0.81 $44,693,103 4.83 44,693,103.00 LITHUANIA (REPUBLIC OF) RegS 0.81 $44,657,864 5.36 44,657,863.89 The complete Holdings data of EMB is available here . I believe we are still in the early stages of the trade and we have a long way to go as the U.S. starts tightening and Emerging Markets start getting squeezed. The Fed has indicated that rates will not rise too quickly but I believe that once rates come up and people start anticipating the changes in dynamics worldwide, emerging market bond prices could accelerate downwards owing to the catalysts discussed below. The time horizon for this trade to play out would be around 1 year starting from the date the U.S. starts raising rates. From the graph above, we can see that the risks associated with the increasing U.S. Dollar have not yet been priced into EMB (see the divergence). CATALYSTS A strengthening U.S. Dollar will raise the probability of defaults. Although if none of the emerging countries defaults, when the increased risks get priced into the bonds this will likely create downward pressure on bond prices. The odds of higher default risks getting priced in are quite high post the Greek debt default saga. The slowing economic growths in multiple emerging markets could act as a tailwind to EMB’s collapse. One salient example is Russia which is the world’s largest exporter of energy. It is technically in a recession since the collapse of the oil price. In addition, inflationary pressures could provide further impetus to raise rates to stoke inflation. The effective duration of the portfolio is 7.53 years. When risk gets priced in, a long-duration portfolio is likely to face significant downward pressure. (Theoretically, for every 1% rise in yield of the portfolio, we expect the portfolio to go down in value by 7.53%). The imminent rise in the U.S. interest rates could also pose a danger to emerging market bonds as ultimately, the U.S. starts exporting its tightening monetary policy overseas. Technically, EMB looks poised for breaking the near-term resistance level around the 107.50-108 area. Once this happens, we’ll be looking at testing the 105 level and if this goes, EMB could quickly accelerate towards 100 break down further. (click to enlarge) As always, we can’t have 100% certainty when putting on a trade but as traders, our job is to put all the odds in our favor. We have an unfavorable macro environment for emerging market debt and in addition to that, slowing economic growths in emerging countries are likely to put pressure on sovereign debt financing. Furthermore, we’ve seen that the EMB portfolio has a long duration and any spikes in bind price volatility due to increased risks being priced in have the potential to accelerate the decline of the EMB. Disclosure: I am/we are short EMB. (More…) I wrote this article myself, and it expresses my own opinions. I am not receiving compensation for it (other than from Seeking Alpha). I have no business relationship with any company whose stock is mentioned in this article.