IDACORP: Dividend Investors Shouldn’t Overlook This Idaho Utility
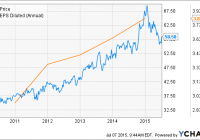
Summary Idaho electric utility IDACORP will likely see its earnings growth streak snapped this year due to a warm Q1 and drought conditions in its service area. The company’s earnings should still be strong, however, due to its record of achieving high ROEs and solid economic growth in its service area. While its shares are not undervalued at this time, headlines about the effects of a strong El Niño later in the year could make IDACORP’s forward valuations more attractive. Shares of Idaho-based regulated electric utility holding company IDACORP (NYSE: IDA ) have fallen sharply in value since the beginning of the year, marking their largest such decline in at least five years (see figure). The drop has coincided with the presence of severe drought conditions in the Western U.S., including in much of the company’s service area, that have substantially reduced its hydroelectric output. While the company’s annual earnings are now expected to fall on a YoY basis in FY 2015 for the first time in almost a decade as a result, it remains a solid firm with good dividend growth potential. This article evaluates IDACORP as a potential long investment in light of these conditions. IDA data by YCharts IDACORP at a glance IDACORP operates in the regulated and non-regulated electric utility sector via its two primary subsidiaries, Idaho Power Co. and Ida-West Energy. It also operates IDACORP Financial, which oversees non-regulated, non-utility investments in affordable housing projects and tax credit-earning historical rehabilitation projects. Its main segment Idaho Power, however, is a regulated electric utility that generates and distributes electricity in Idaho and east Oregon. Idaho Power provides electricity to nearly 516,000 customers via 3,594 MW capacity. This capacity consists of a mix of renewable and fossil facilities, including 48% hydroelectric, 31% coal, and 21% natural gas. It also provides an additional 2,842 thousand MWh of electricity from wind, biomass, and other renewables via long-term purchase power agreements. Finally, Ida-West is a non-regulated electric utility that owns 50% equity stakes in nine hydroelectric projects in Idaho and California with a combined generating capacity of 44.6 MW. Ida-West formerly also engaged in project development, although it is now a pure-play electric utility. IDACORP has benefited from robust electricity demand in its service area and favorable regulatory schemes, generating 7% annual earnings growth since FY 2010. The combination of this earnings growth and the regulatory schemes has allowed it to report annual ROEs of roughly 10% each year since FY 2011, easily topping the industry average. Furthermore, the company has also managed to top its median EPS annual guidance since FY 2010. Not surprisingly, given its financial performance, the company’s dividend has also steadily grown. Following a large 9.3% increase to its quarterly dividend in Q3 2014 that brought it up to $0.47/share, or a 3.2% forward annual yield, the company has increased its quarterly dividend by 57% since Q4 2011, resulting in a payout ratio of 48%. Rather surprisingly, given this performance, the company is very undercovered, with almost a decade passing since it was last the subject of an article on Seeking Alpha and only two analysts joining the most recent earnings call . Q1 earnings IDACORP reported its Q1 earnings at the end of April. Its revenue declined by 4.5% YoY from $292.7 million to $279.4 million. Management attributed the fall to the presence of warm weather during the quarter, with 13% fewer heating degree days than Q1 2014 and 15% fewer heating degree days than the long-term average. This was partially offset by customer growth, with the total number of customers rising by 1.6% over the trailing twelve months as of the end of Q1. Operating income fell to $42.9 million from $48.6 million the previous year. While the increased number of customers increased the most recent result by $1.9 million. This was more than offset by increases to depreciation (up $1.2 million) and O&M (up $3 million). Neither of these increases were necessarily negative to the company’s long-term outlook, however, as the former was the result of a $170 million increase YoY to net PP&E while the latter was scheduled to occur in Q2 before being moved up in response to slack Q1 demand. Net income fell from $27.4 million to $23.4 million YoY (see table). Diluted EPS came in at $0.47, down from $0.55 and missing the analyst consensus by $0.11. While substantial, the miss was due to the warm Q1 weather, which resulted in an EPS hit of $0.05, and the O&M increase, which reduced it by another $0.06. Suffice to say that the weather is outside of the company’s control while the maintenance costs would have been incurred in Q2, so excluding these two effects, the company’s earnings were in line with expectations. Operating cash flow ultimately increased YoY by $8.5 million to $105.4 million due to the impact of a cost adjustment mechanism on the company’s power supply costs. IDACORP Financials (non-adjusted) Q1 2015 Q4 2014 Q3 2014 Q2 2014 Q1 2014 Revenue ($MM) 279.4 289.8 382.2 317.8 292.7 Gross income ($MM) 177.2 183.4 240.7 211.7 178.6 Net income ($MM) 23.4 34.6 86.9 44.5 27.4 Diluted EPS ($) 0.47 0.69 1.73 0.89 0.55 EBITDA ($MM) 84.9 74.3 154.7 115.1 89.8 Source: Morningstar (2015). IDACORP ended the quarter with $317.2 million in total cash, up from $56.8 million QoQ and $88.3 million YoY. The increase was driven by the strong operating cash flow and a decision by management to pay off $120 million of debt yielding 6% and maturing in FY 2018. This was replaced by $250 million of debt yielding 3% and maturing in FY 2045. In addition to increasing the company’s cash reserve and greatly extending the horizon of its total debt, this move also reduces its annual interest expense by a net of $2 million. At the end of Q1, the company had no long-term debt due before 2019, with most of it not requiring full repayment until after 2032. Outlook Management reaffirmed its FY 2015 diluted EPS guidance range of $3.65 to $3.80 during the Q1 earnings call, with the Q1 miss being offset by the timing of the O&M expense and a $5 million tax benefit resulting from the aforementioned debt refinancing. It did, however, reduce its hydroelectric output guidance for the year down from 7-9 million MWh to 5-7 million MWh due to the warm Q1 weather and reduced snowpack levels. This raises the question of whether or not investors should expect the Q1 weather to have been a one-time event that will be offset by more favorable conditions in the future. While the persistence of extreme drought conditions in California has received the bulk of public attention this year, several of IDACORP’s hydroelectric facilities in Idaho and on the Oregon border are in counties experiencing severe and extreme drought conditions. The Snake River basin, for example, was determined by Washington back in April to be at or below 75% of its normal water supply. Worse, the Snake River’s streamflow is expected to remain below 50% of its normal flow through the end of this summer. The possibility of El Niño conditions manifesting themselves later this year has the ability to further complicate IDACORP’s outlook, at least as far as weather is concerned. While a strong event would result in wetter weather for California, a NOAA analysis from the 1990s determined that winter precipitation in Idaho fell by as much as 20% on average during past events. Worse, El Niño conditions are also associated with warmer winter temperatures . Q4 2015 and Q1 2016 could therefore see both reduced demand as well as reduced hydroelectric generation in IDACORP’s service area compared to previous years. The good news for the company’s investors is that it is asking state regulators to use a weather-normalization mechanism that would smooth out fixed cost collection, mitigating the effects of extreme weather events on the company’s earnings. Furthermore, the company still has $45 million of accumulated deferred investment tax credits that can be used to achieve an annual ROE of 9.5% in Idaho in the event that pre-tax earnings fall short of this rate. These two safeguards should prevent another low-demand, low-output winter from having a major impact on the company’s earnings, although an especially strong El Niño would likely still cause it to miss the consensus for Q4 2015 and/or Q1 2016. Weather aside, however, IDACORP continues to benefit from its service area’s strong economy. Idaho’s unemployment rate is well below the U.S. average (see figure) while that of Oregon has improved of late. Management reported during the earnings call that it is seeing 4% unemployment in its service area, below the U.S. average of 5.3%. Idaho’s economic outlook has also improved of late, and the service area’s GDP is now expected to reach as high as 3.8% in FY 2015, up from January’s estimate of up to 3.5% for the year. NOAA is forecasting for Q3 to be both wetter and warmer than average in Idaho, conditions that would boost hydroelectric supply and electricity demand. Looking further ahead, the company is investing in new interstate transmission lines that, combined with maintenance, are expected to incur capital expenditures of $1.5 billion through 2019. This, combined with the existence of low rates for customers at present (as much as 20% below the national average), should provide the company with substantial leeway from regulators in the event that weather conditions threaten its future ROEs. Finally, IDACORP’s management intends to increase its distributions to shareholders, as evidenced by the most recent dividend increase. A dividend payout ratio of 50-60% is being targeted, with increases of 5% or more being anticipated to achieve this range from the current ratio of 48%. Idaho Unemployment Rate data by YCharts Valuation The consensus analyst estimates for IDACORP’s diluted EPS in FY 2015 and FY 2016, which have remained unchanged over the last 90 days, are $3.72 and $3.81, respectively. While lower than in FY 2014, these numbers would still represent strong results for the company. Based on the company’s share price of $58.58 at the time of writing, its shares are currently trading at a trailing P/E ratio of 15.5x and forward FY 2015 and FY 2016 ratios of 15.7x and 15.4x, respectively. While a bit lower than the sector average, all three ratios are well above their respective 5-year lows (see figure), suggesting that its shares are not undervalued at present. IDA PE Ratio (TTM) data by YCharts Conclusion IDACORP will likely see its rapid earnings growth falter a bit in FY 2015, although the magnitude of this shift will ultimately depend on unpredictable weather conditions later in the year. Its long-term growth potential is still positive, however, and its dividend has room remaining for significant increases before the upper bound of management’s target dividend payout ratio range is achieved. The company’s strong record of impressive ROEs, steady earnings growth, and multiple dividend increases makes IDACORP an attractive investment option for those investors seeking exposure to utilities. Its shares are not undervalued at this time and value investors may find that the news of reduced precipitation levels and temperatures in the coming winter resulting from a strong El Niño end up reducing the company’s valuation still further. With that in mind, I would not hesitate to purchase its shares for under $50, or approximately 13x its FY 2016 earnings, especially if management’s efforts to mitigate its weather-related earnings impacts are successful. Disclosure: I/we have no positions in any stocks mentioned, and no plans to initiate any positions within the next 72 hours. (More…) I wrote this article myself, and it expresses my own opinions. I am not receiving compensation for it (other than from Seeking Alpha). I have no business relationship with any company whose stock is mentioned in this article.