Tag Archives: send-xhr-start

iPath Natural Gas ETN Is A Broken Product

ETF and ETN investors should avoid broken products. I have repeated this caution numerous times over the years. Upon hearing this warning, most investors want to know what a broken product is. Once they understand the definition, they quickly grasp the danger. ETFs and ETNs are unique securities. The primary feature that differentiates them from other investment vehicles is the ability to create and redeem shares, typically through an in-kind exchange process. Another key feature is the publishing of the underlying portfolio’s value throughout the trading day. The two features combined allow market makers to keep the trading price very close to the value (often called the Intraday Value or the iNAV). This is the “promise” behind ETFs and ETNs, and investors expect these products to live up to it. However, sometimes the share creation mechanism is suspended or terminated for a given product, and that is when it becomes a broken product. Without a viable share creation process, an ETF or ETN can trade like a closed-end fund with price premiums. The typical retail investor does not have an easy way of knowing if a product is broken or not, and that is where the danger lies. It could be trading at a substantial premium, a premium that could disappear instantly. This is not just a theoretical problem; it is very real and happening today. You are probably aware that crude oil prices have been falling for a number of months. More recently, natural gas prices plunged. ETFs and ETNs tracking natural gas fell right along with the underlying commodity. Last week, the United States Natural Gas Fund (NYSEARCA: UNG ) dropped 12.5%. The leveraged ProShares Ultra Bloomberg Natural Gas ETF (NYSEARCA: BOIL ) was whacked for a 22.6% loss. However, the iPath DJ-UBS Natural Gas Total Return Sub-Index ETN (NYSEARCA: GAZ ), an unleveraged product tracking the same index as BOIL, gained 5.9%. The reason for this is because GAZ is a broken product. On August 21, 2009, Barclays “temporarily suspended” the creation unit process for GAZ . More than five years later it is still suspended, straining the credibility of the word temporarily. I’m willing to bet most investors are unaware GAZ is broken. Without the ability to create and redeem units of GAZ, it is impossible for market makers to keep the trading price near the net asset value (“NAV”). The NAV of GAZ went from $1.9182 to $1.5874 per unit last week, a plunge of 17.2%. The price went the other way, increasing from $2.02 to $2.14. GAZ started the week trading at a 5.3% premium and closed with a 34.8% premium. The premium narrowed slightly earlier this week, but it was more than 36% at the close on Wednesday. Anyone buying GAZ today is far more than it is worth. This is not a traditional liquidity problem, as GAZ has averaged more than 100,000 shares a day recently. This high volume suggests that many participants are unaware of its broken product status. One day, regulators may require investors be informed they are buying a broken product by requiring a ticker symbol suffix or some other means. Until then, be careful out there, and don’t get caught owning a broken product when the premium disappears . Disclosure covering writer, editor, and publisher: No positions in any of the securities mentioned. No positions in any of the companies or ETF sponsors mentioned. No income, revenue, or other compensation (either directly or indirectly) received from, or on behalf of, any of the companies or ETF sponsors mentioned.
Ride The January Effect With These ETFs And Stocks

January is usually a pretty strong month for stocks, suggesting that many could see large gains to start the year if historical trends hold true yet again. This is largely attributed to the ‘January Effect’. What is the January Effect? The January Effect is a historically observed increase in stock prices in the month of January due largely to year-end tax considerations. It is a seasonal anomaly in which investors redeploy their capital in the stock market in January after a sell-off in December to create tax losses. This phenomenon pushes the stock market higher in the first month of the year. While large caps tend to perform better, small-cap securities have historically proven their outperformance in January. According to some market experts, the January Effect actually runs from mid December through February, with the small caps continuing to outperform their large-cap cousins. January Effect Never Looked More Good While most of the developed and developing economies are now struggling to reinvigorate growth and fighting deflation in this fear-ridden world, the U.S. economy is growing at a faster rate not seen in more than a decade. Given this, small caps seem to be the perfect choice in the present scenario where the American economy is way ahead of the others. This is because these pint-sized stocks are closely tied to the U.S. economy and generate most of their revenues from the domestic market making them great choices in a trending U.S. market. Further, these companies are small and are poised to grow higher than their already tapped out large-cap counterparts. These fundamentals will support the surge in the small-cap space going forward and the outperformance is likely to be more evident in the first month of the year if history is any guide. For investors seeking to capitalize on the opportunity of the January Effect in basket form, the following small-cap ETFs and stocks could be solid pure play choices if it materializes in 2015. ETFs to Consider While there are several options in the small-cap ETF space, we have highlighted those that have gained strong momentum last month and this trend is likely to continue in the first month of 2015 given their favorable Zacks ETF Rank of 3 or ‘Hold’ rating. iShares Micro-Cap ETF (NYSEARCA: IWC ) This ETF tracks the Russell Microcap Index, holding a large basket of 1,426 mini securities. The fund is widely diversified across each security as none of them holds more than 0.87% of total assets. From a sector look, financials and health care take the top two spots with 25.4% and 23.9% share, respectively, while information technology, consumer discretionary and industrials round off the top five. The fund has amassed $973.5 million in its asset base and trades in volume of less than million shares per day. The ETF charges 60 bps in annual fees and gained nearly 5% over the past one month. First Trust Small Cap Core AlphaDEX ETF (NYSEARCA: FYX ) This fund follows an AlphaDEX methodology and ranks stocks in the space by various growth and value factors, eliminating the bottom ranked 25% of the stocks. This approach results in a basket of 448 stocks that are well spread out across each security with none holding more than 0.56% of assets. Sector wise, the product is highly diversified with industrials, information technology and financials making up for the top three sectors. FYX is rich in AUM of $600.5 million and sees moderate volume of around 72,000 shares a day. Expense ratio came in at 0.66% and the ETF is up 4.2% over the past month. RevenueShares Small Cap ETF (NYSEARCA: RWJ ) This product tracks the RevenueShares Small Cap Index and offers exposure to about 600 stocks that are weighted by revenues instead of market capitalization. SYNNEX Corp. (NYSE: SNX ) occupies the top position at 2.13% in the basket, while other firms hold less than 1.50% of assets. In terms of industrial exposure, consumer discretionary and industrials are the top two sectors at 23.8% and 21.2%, respectively, closely followed by consumer staples (18.1%). The fund has amassed $325.1 million in its asset base, while it charges 54 bps in fees per year from investors. Volume is light coming under 28,000 shares a day on an average. The ETF added 4.1% in the last month. Stocks to Consider In the stock world, it is difficult to identify the stocks that will outperform in 2015. As such, we have screened for a number of criteria with the help of our Zacks Screener and have emerged with a handful of great picks for January. The eligible benchmarks include a Zacks Rank # 3 (Hold) or better, positive industry Zacks Rank, upward earnings estimate revisions and above-average returns in the last month. Bio-Reference Laboratories Inc. (NASDAQ: BRLI ) Based in Elmwood Park, NJ, Bio-Reference Laboratories is the third largest full service clinical diagnostic laboratory in the U.S. providing testing services for the detection, diagnosis, evaluation, monitoring, and treatment of diseases primarily in the greater New York metropolitan area. The company has seen rising earnings estimates by 4.4% for 2014 over the past one month. The stock gained 12.7% last month and has a Zacks Rank #1. It comes under an industry that has a solid Zacks Industry rank in the top 33%, suggesting their outperformance in the coming weeks. Moelis & Company (NYSE: MC ) Based in New York, Moelis & Company is a leading global independent investment bank offering strategic and financial advisory services in the United States and internationally. The company has seen positive earnings estimate revision of 3.5% for 2014 over the past one month. The stock gained over 4% last month and is expected to continue to rise given that it has a Zacks Rank #2 and an industry Rank in the top 23%. Regis Corp. (NYSE: RGS ) Based in Edina, MN, Regis Corp. is the beauty industry’s global leader in beauty salons, hair restoration centers, and cosmetology education. It is the owner, operator, and franchiser of hairstyling and hair care salons for men, women, and children in the United States, the United Kingdom, Canada, and Puerto Rico. The company sees impressive earnings estimate revisions of 20% for 2014. It added 2% last month and has a Zacks Rank #3 with a strong industry Zacks Rank in the top 12%. Bottom Line January is truly the time to get in on small-cap securities, assuming that the historical trend holds true in 2015. The above-mentioned ETFs and stocks have outperformed the broader market by a wide margin last month. This trend is likely to continue with an improving economy and a booming stock market that has boosted the appeal of these pint-sized products.

The Best And Worst Performing Assets Of 2014

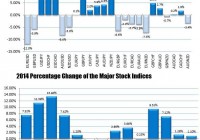
By Matt Rego With 2015 officially rung in and the first trading day of the New Year in progress, 2014 is fading off into the distance. But, before it goes, let’s take a look at some of the best and worst performing assets of 2014, which can help formulate an investment plan for the current year. Reviewing prior year is a good habit to get used to, as it can show what assets could outperform this year or which could underperform this year. Ultimately, it is good to close out a year with a review and a takeaway that will allow us to improve our analysis scope and where some investments made during the year went wrong or right. Best And Worst Performing Assets: Stocks US equities continued to march higher in 2014, as the bull market continued to show strength during the year. Dow Jones Industrial Average rose 8.4% in 2014, S&P 500 rose 12.39%, and the Nasdaq led the group of US indices with 14.31% gain for the year. Turning to European equities, the FTSE 100 (INDEXFTSE:UKX) lost -2.26% for the year, the CAC 40 rose 1.08%, and Euro Stoxx 50 saw a rise of 2.48% in 2014. The Shanghai Composite, Chinese equities, rose 53.94% in 2014 and Japan’s Nikkei 225 (INDEXNIKKEI:NI225) saw 2014 outcome of -1.93% ( Google Finance data) Best And Worst Performing Assets: Commodities Commodities had a good start in 2014, but as the US dollar continued to build strength in the latter half of the year, commodities began to suffer. The biggest and most memorable story of 2014 for commodities will be the collapse in oil prices, which fell -44.5% during the year. Natural gas lost -29% and heating oil was the second worst performing commodity at -39.6%. Gold ended the year down, but relatively flat overall with -2.9% 2014 performance. Silver fared much worse, which fell -20.7%. On the bright side, coffee was the overwhelming best performing commodity, which shot up 44.8%. Cattle prices had a huge run up in 2014, led by feeder cattle’s gains of 33.7%. Live cattle saw gains of 22.1% and lean hogs was worst performer of the livestock sector, down -6.6% for the year. The US dollar rose 12.9% during the year. Best And Worst Performing Assets: Bond Yields Bond yields across the board saw declines in 2014. Yields and bond prices work inversely, meaning bond prices rallied in 2014 as yields sank. The US 10 Year saw yields fall -0.857 basis points, Germany’s 10 year fell -1.387 bps, UK saw a drop of -1.266 bps, Japan’s 10 year saw the lowest fall in yield at -0.412 bps. Spain’s 10 year yields fell the most by -2.54 bps, followed by Italy’s 10 year yield declines of -2.235 bps. Overall, 2014 was a good year for US equities, the US dollar, cattle, coffee, and bond prices. Looking forward to 2015, analysts and economists are forecasting continued strength in the US dollar, which will mean lagging commodity prices. US equities have the general consensus of starting the year off strong and getting weaker as the year rolls on. Bonds are predicted to have a very rough year with the US Federal Reserve expected to raise rates at some point. Ultimately, we will have to wait and see what the New Year brings. Disclosure: None