Tag Archives: send-xhr-start

Vanguard FTSE Pacific ETF Is Mostly Japanese Stocks, But It Looks Compelling

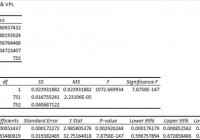
Summary VPL has a respectably low correlation to SPY and isn’t too volatile in its own right. The expense ratios are low and the liquidity is strong, but the ETF is currently trading at a premium to NAV. Despite the name, China is almost completely excluded while Japan and Australia dominate most of the portfolio. Investors should be seeking to improve their risk-adjusted returns. I’m a big fan of using ETFs to achieve the risk-adjusted returns relative to the portfolios that a normal investor can generate for themselves after trading costs. I’m working on building a new portfolio and I’m going to be analyzing several of the ETFs that I am considering for my personal portfolio. A substantial portion of my analysis will use modern portfolio theory, so my goal is to find ways to minimize costs while achieving diversification to reduce my risk level. In this article, I’m reviewing the Vanguard FTSE Pacific ETF (NYSEARCA: VPL ). What does VPL do? VPL attempts to track the investment results of the FTSE Developed Asia Pacific Index. The ETF falls under the category of “Diversified Pacific/Asia”. Does VPL provide diversification benefits to a portfolio? Each investor may hold a different portfolio, but I use the SPDR S&P 500 Trust ETF (NYSEARCA: SPY ) as the basis for my analysis. I believe SPY, or another large-cap U.S. fund with similar properties, represents the reasonable first step for many investors designing an ETF portfolio. Therefore, I start my diversification analysis by seeing how it works with SPY. I start with an ANOVA table: (click to enlarge) The correlation is about 77%, which is low enough that I’m expecting to see significant diversification benefits. Standard deviation of daily returns (dividend adjusted, measured since January 2012) The standard deviation isn’t too bad. For the period I’ve chosen, the standard deviation of daily returns was .889%. For SPY, it was 0.736% over the same period. While VPL is more volatile than SPY, the difference isn’t huge enough to prevent the low correlation from reducing portfolio risk if the level of exposure is right. Mixing it with SPY I also run comparison on the standard deviation of daily returns for the portfolio assuming that the portfolio is combined with the S&P 500. For research, I assume daily rebalancing because it dramatically simplifies the math. With a 50/50 weighting in a portfolio holding only SPY and VPL, the standard deviation of daily returns across the entire portfolio is 0.764%. If the position in SPY is raised to 80% while VPL is used at 20%, the standard deviation of daily returns drops down to 0.734%. This is slightly below the standard deviation of a portfolio that only holds SPY. In practice, I would want to limit a position in VPL to no more than 20% of the portfolio, but I’d prefer to use an amount that was still lower. The low correlation makes a very strong case for using VPL in a small position to enhance diversification. At 5%, the standard deviation of the portfolio would have been 0.733%. If an investor was only measuring risk based off the standard deviation of returns, it would appear that the 20% to 5% range was very reasonable. I’d lean towards being a little more conservative with the exposure. I think 10% to 5% is a fairly reasonable range. Why I use standard deviation of daily returns I don’t believe historical returns have predictive power for future returns, but I do believe historical values for standard deviations of returns relative to other ETFs have some predictive power on future risks and correlations. Yield & Taxes The distribution yield is 2.7%. It’s high enough that the portfolio could be included as part of an ETF portfolio designed for a retiring investor. If an investor wants to ensure they aren’t tempted to get into the portfolio, the strong yields are nice. Expense Ratio The ETF is posting .12% for an expense ratio, which is a very reasonable cost for the diversification. Unfortunately, most ETFs have expense ratios higher than I’d like to see. Clearly, VPL isn’t one of those ETFs. Vanguard funds usually have low expense ratios, which is one of the more appealing things about using their ETFs. Market to NAV The ETF is trading at a .22% premium to NAV currently. I think any ETF is significantly less attractive when it trades above NAV. I wouldn’t have expected such a significant premium on an ETF with over a million shares per day trading hands. I may need to dig deeper into the ETF to look for a reason for that premium and determine if it is normal for the ETF to trade at a premium. Aside from that premium, this is one of the better foreign ETFs I’ve seen. Largest Holdings The diversification within the ETF is pretty good. Despite the largest position being over 3%, the allocations drop off rapidly before we are even out of the top 10. I find that attractive because it ensures investors are getting some diversification benefits within the individual holdings as a benefit for paying the expense ratio. (click to enlarge) Investing in the ETF is largely relying on modern portfolio theory. The argument for the investment is the respectably low correlation of the portfolio to the major U.S. index funds. Making an investment requires a belief that markets are at least somewhat efficient so that the companies within the portfolio will be reasonably priced. Conclusion The ETF looks less volatile than many of the foreign ETFs I have been considering. I’m finding that to be an attractive factor even though there is significant correlation between VPL and the other international market ETFs. So far, VPL is easily one of the stronger contenders for the foreign exposure area in my IRA. The ETF simply does very well on several metrics. Toyota (NYSE: TM ) is a very solid company to have as the top holding. The most interesting thing I found while researching the ETF is that the exposure isn’t quite what I would have expected when broken down by individual countries. I figured Japan would be a significant part of the portfolio, but being over 50% of the portfolio is enough to concern me a little bit. Despite the strong focus on a single foreign country, the volatility has been much lower than competing ETFs with much broader focuses. Australia is the second largest representation at nearly 20%. That’s okay with me. BHP Billiton (NYSE: BHP ) is a quality company that I’d have no issue with having in my portfolio despite the terrible performance lately of mining stocks. Hong Kong is represented with 7% of the portfolio, but China is less than 1%. When I’m looking at something labeled “Asia Pacific”, I generally expect substantially more Chinese companies to be included. If I had commission-free trading on VPL so I could keep rebalancing the position for free, it would be a pretty much automatic pick for my foreign exposure. In that hypothetical scenario, I’d lean towards a 5% exposure. Additional disclosure: Information in this article represents the opinion of the analyst. All statements are represented as opinions, rather than facts, and should not be construed as advice to buy or sell a security. Ratings of “outperform” and “underperform” reflect the analyst’s estimation of a divergence between the market value for a security and the price that would be appropriate given the potential for risks and returns relative to other securities. The analyst does not know your particular objectives for returns or constraints upon investing. All investors are encouraged to do their own research before making any investment decision. Information is regularly obtained from Yahoo Finance, Google Finance, and SEC Database. If Yahoo, Google, or the SEC database contained faulty or old information it could be incorporated into my analysis. The analyst holds a diversified portfolio including mutual funds or index funds which may include a small long exposure to the stock.
Hedge Against 2015 Central Bank Surprise With Gold

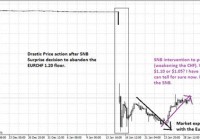
In the first month of 2015 alone, we have seen surprises from the Central Banks of Switzerland, India and Singapore. SNB is now moving to weaken the CHF at an undefined range and might follow Singapore’s practice of linking the CHF against a basket of trade weighted currencies. RBI and MAS surprise moves are related to inflation and serves to weaken their currencies. Biggest risk is Fed not raising rates in mid 2015 causing unexpected financial instability although this is a slim possibility now. Gain small exposure to gold through XAU/USD or GLD to hedge against financial instability. Background of Central Bank Surprises This is only the first month of the year but already 2015 is starting out to be a year of Central Bank surprises. The first Central Bank decision to shock the world and this might not be the last in terms of scale of impact is the decision by the Swiss National Bank (SNB) to abandon the EURCHF floor of 1.20 in an unscheduled press conference on 15 January 2015. This overshadowed the second Central Bank surprise decision by the Reserve Bank of India (RBI) to cut interest rates by 25 basis points on the same day. Then to round it up, tiny Singapore, perhaps influenced by the Swiss or the Fed (took action on same day as the FOMC Statement) have decided to ease monetary policy through their exchange rate on 28 January 2015. In this article, I will go through the surprises of various Central Banks of Switzerland, India and Singapore and then its implications for Gold. Finally I am going to shift my focus on the biggest Central Bank surprise this year which might give investors a reason to gain exposure to gold for hedging purpose. Spotlight on Switzerland The SNB surprise decision set the benchmark for Central Bank surprise with its trademark adjustment between scheduled meetings complete with a hastily summoned press conference to drop the bomb on the unsuspecting investing public. The SNB decision to abandon the peg is because it knows that it cannot possibly hold the line after the ECB has gotten legal green light to print more euros through its QE program. The implications on gold has been mentioned in detail in my previous article, The SNB Catalyst For GLD . Now we have renewed speculations that the SNB has already swapped one form of intervention for another. While the SNB finds it hard to defend the line at $1.20 after announcing it to the world, it is managing the rise of the CHF after the abandonment at an unknown level. In the USDCHF and EURCHF charts below, we can see that the CHF has been weakening after its sharp strength on the day of the surprise announcement. (click to enlarge) (click to enlarge) I will not repeat what is stated in the chart above and I believe enough ink has been spilled on this topic. What is worth mentioning is that SNB Vice Chairman (second only to SNB Chairman Thomas Jordan) Jean-Pierre Danthine proclaimed 3 days before the peg abandonment that it is still official policy which certainly fooled everyone. The lesson is that if the Central Bank wants to surprise or fool you if they want to do something as drastic as removing a cap to prevent any ‘leakage’ which will be the same as a formal announcement and not even the IMF has heard of it beforehand. Now this same Jean-Pierre mentioned that the SNB is now back in action to weaken the CHF and it is considering to follow Singapore’s lead to link its currency to a basket of trade-weighted currencies. If this is followed through, it would mean that the official level is now secret or at the very least constantly changing. While the SNB has a credibility issue now, they have a good record of intervening in the market and they hold the upper hand as they have more latitude to print CHF. We can the effects of their action in the charts above which reversed the natural strengthening of the CHF on the following Monday on 19 January 2015 and the CHF started to weaken. In other words, the SNB only allowed the weakening for 2 market days after their announcement. While his personal reputation might be in tatters now, we can see it from the SNB interest and believe that the SNB would not allow the CHF to weaken too much and weaken the economy. India and Singapore The RBI also surprised the market by cutting interest rates by 25 basis points to 7.75% in between meetings on the same day as the SNB. This is its first cut since March 2013 and it is not scheduled to meet until 03 February 2015. This cut is motivated by the weakness in fiscal conditions and the weakening inflation environment. The timing of this move shows that RBI Governor Dr. Raghuram Rajan might be under the influence that inflation would be soft with a weaker Europe and QE in full mode for Europe and Japan. This indicates that Rajan is trying to get more bang for his money in weakening the Indian Rupee. The more recent surprise came from Singapore’s Central Bank, Monetary Authority of Singapore (MAS). MAS controls inflation through the exchange rate against its trade partner and like Switzerland, it is a small country with a large export sector. Singapore process the oil with its refineries and Switzerland process the gold of other countries among other manufacturing exports. Both countries have an active and well regarded financial services center in the world too. The Straits Times announced that MAS has moved to ease its policy band of exchange rates on 28 January 2015 as it cuts its inflation outlook from 0.5% to 1.5% to -0.5% to 0.5%. This has caused the SGD to weaken against the USD by at least 1% on that day. This announcement came before its scheduled meeting in April 2015 and surprised the market. While this does not have a big impact on the market, this shows the tendency for Central Bank to surprise the market. (click to enlarge) The USDSGD has strengthen 1.04% from the opening price of 1.3387 to its closing price of 1.3529 on the day of the MAS announcement as shown on the chart above. This is part of the gradual strengthening process of the USD against the SGD so this is not such a drastic move. Will there be a Fed Surprise? In light of these Central Bank surprises, the biggest surprise of all will be the decision by the Fed to delay its rate hike decision from mid 2015 which is the market consensus to a later date of the last quarter of 2015 or even early 2016. While this remains a fairly unlikely event, we will have to consider hedging a portion of our exposure against such a possibility especially those who are expecting higher bond yields with the rate hike. Of course, one can always hedge through exposure to equities which will raise with a de facto monetary loosening with a delayed rate, equities does not give much of a hedge against systemic risk or financial instability that can come about from Central Bank actions. Recall that the 1997 Asian Financial Crisis occurred because its central bank cannot stand against currency speculation attacks or how George Soros made his name and money by prevailing against the Bank of England. Gold will be your friend if the failure of the Fed to raise rates in a timely manner triggers systemic instability in the financial system after priming the market for such an extended period with its first taper hints in 2013. There are 2 liquid ways to gain exposure to gold in your portfolio and they are either the forex way or the Exchange Traded Fund (ETF) way. Hedging for a Fed triggered Financial Instability For those with access to a brokerage account, they can gain exposure with a long XAU/USD position. Note that XAU is the forex symbol for gold. The weekly chart below shows that gold has a multi-week turnaround into strength after months of weakness. This represents the market fledging worry about financial stability which I have mentioned in my previous articles. This is not a full fledged worry yet if not gold would have spiked higher but a clear manifestation nonetheless. (click to enlarge) We can also note that representation of volatility ATR is creeping up too. (click to enlarge) The daily chart of XAU/USD shows us that this week and probably the next will present good entry price for gold as the market is in retracement. (click to enlarge) For those without access to a forex broker, the SPDR Gold Trust ETF (NYSEARCA: GLD ) will do. As you can see above, it has a volume of 8.4 Million on 28 January 2015 and this is its average volume. It also has a market capitalization of $31.09 billion which makes it at least as liquid as the XAU/USD which has a bid-ask spread of $0.22 on my FXCM broker. As the recent SNB surprise decision has shown, leverage can cut both ways and for investors who wants to avoid the leverage in forex, GLD is the way to hedge your exposure. It is better to be early than late.

Talking About Value Investing And Fed Policy (Video)

Here is the second part of my interview on RT Boom/Bust. It was recorded while the FOMC was releasing its statement, so I had no idea at that time as to what the announcement had been. The interview covers my view of Apple (NASDAQ: AAPL ) (not one of my strong points), Fed Policy, and what should value investors do in this low interest rate environment. Note that not all of my opinions are strong ones, and that in my opinion is a good thing. Often the best opinions are not controversial. If you are interested in these topics, or listening to me, then please enjoy the above video. My segment is about seven minutes long. Disclosure: None Share this article with a colleague