Tag Archives: send-xhr-start

CROP Isn’t Growing Fast Enough, Even The Discount To NAV Will Not Attract Me

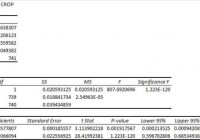
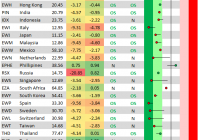
Summary I’m taking a look at CROP as a candidate for inclusion in my ETF portfolio. The expense ratio seems to be justified by not being market weighted, but the diversification within the fund is weak. The correlation to SPY is easily the most attractive characteristic, but it is combined with moderate volatility and very weak returns. I’m not assessing any tax impacts. Investors should check their own situation for tax exposure. Investors should be seeking to improve their risk adjusted returns. I’m a big fan of using ETFs to achieve the risk adjusted returns relative to the portfolios that a normal investor can generate for themselves after trading costs. I’m working on building a new portfolio and I’m going to be analyzing several of the ETFs that I am considering for my personal portfolio. One of the funds that I’m considering is the IQ Global Agribusiness Small Cap ETF (NYSEARCA: CROP ). I’ll be performing a substantial portion of my analysis along the lines of modern portfolio theory, so my goal is to find ways to minimize costs while achieving diversification to reduce my risk level. What does CROP do? CROP attempts to track the total return (before fees and expenses) of the IQ Global Agribusiness Small Cap Index. According to the prospectus, the underlying index “is a rules based, modified capitalization weighted, float adjusted index.” I can appreciate having a weighting system other than simple market capitalization. Weighting by market cap is very easy; the ETF simply buys up the initial amount of shares in each fund and maintains the position. In this case, the ETF is not using a simple market cap weighting. In my opinion, that would justify a slightly higher expense ratio. CROP falls under the category of “Consumer Defensive.” Does CROP provide diversification benefits to a portfolio? Each investor may hold a different portfolio, but I use the SPDR S&P 500 Trust ETF (NYSEARCA: SPY ) as the basis for my analysis. I believe SPY, or another large cap U.S. fund with similar properties, represents the reasonable first step for many investors designing an ETF portfolio. Therefore, I start my diversification analysis by seeing how it works with SPY. I start with an ANOVA table: (click to enlarge) The correlation is excellent at 72%. I want to see low correlations on my investments. Extremely low levels of correlation are wonderful for establishing a more stable portfolio. I consider anything under 50% to be extremely low. However, for equity securities an extremely low correlation is frequently only found when there are substantial issues with trading volumes that may distort the statistics. Standard deviation of daily returns (dividend adjusted, measured since January 2012) The standard deviation is great. For CROP it is .8229%. For SPY, it is .7300% for the same period. SPY usually beats other ETFs in this regard. I like the low correlation and it could be enough to cover the higher standard deviation once we start looking at allocations within a portfolio. Liquidity looks mediocre Average trading volume is pretty low, a bit over 11,000. That isn’t low enough to eliminate it from my consideration, but it is a concern. I’m writing this while the market is open, and the current spread is .36%. That’s a big enough spread to pay attention to when putting in an order. Of course, spreads can change constantly, but investors here should make sure they are using limit orders to prevent crossing a large spread. Mixing it with SPY I also run comparisons on the standard deviation of daily returns for the portfolio assuming that the portfolio is combined with the S&P 500. For research, I assume daily rebalancing because it dramatically simplifies the math. With a 50/50 weighting in a portfolio holding only SPY and CROP, the standard deviation of daily returns across the entire portfolio is .7208%. With 80% in SPY and 20% in CROP, the standard deviation of the portfolio would have been .7121%. If an investor wanted to use CROP as a supplement to their portfolio, the standard deviation across the portfolio with 95% in SPY and 5% in CROP would have been .7238%. Why I use standard deviation of daily returns I don’t believe historical returns have predictive power for future returns, but I do believe historical values for standard deviations of returns relative to other ETFs have some predictive power on future risks and correlations. Yield & Taxes The distribution yield is 1.63%. I like to see strong yields for retiring portfolios because I don’t want to touch the principal. By investing in ETFs I’m removing some of the human emotions, such as panic. Higher yields imply lower growth rates (without reinvestment) over the long term, but that is an acceptable trade off in my opinion. The weak yield makes me less excited about the portfolio from a retirement standpoint, but I have a long ways to go before I’m there. I’m not a CPA or CFP, so I’m not assessing any tax impacts. Expense Ratio The ETF is posting .75% for a gross expense ratio, and .75% for a net expense ratio. I want diversification, I want stability, and I don’t want to pay for them. The expense ratio on this fund is higher than I want to pay for equity securities, but having a better system than a simple market cap weighting provides some justification for the higher ratio. Market to NAV The ETF is at a .96% discount to NAV currently. Premiums or discounts to NAV can change very quickly so investors should check prior to putting in an order. Largest Holdings The diversification within the ETF is very weak. While the weighting method provided some justification for a higher expense ratio, the poor diversification within the holdings severely damages that justification. Rebalancing the fund may require some costs, but having fewer positions to rebalance reduces those costs. (click to enlarge) After looking at the diversification level within the ETF, I’m more critical of the expense ratio. Conclusion I’m currently screening a large volume of ETFs for my own portfolio. The portfolio I’m building is through Schwab, so I’m able to trade CROP with no commissions. I have a strong preference for researching ETFs that are free to trade in my account, so most of my research will be on ETFs that fall under the “ETF OneSource” program. For a correlation of 72% and more volatility than SPY, I would have expected the ETF to have more significant returns. I don’t believe in using past performance to predict future performance, but if an ETF shows moderate or higher correlation and weak performance, it makes me doubtful. During the time period I used (almost 3 years) SPY went up by over 66%. Crop went up by 14%. That isn’t terrible if the ETF is extremely low risk, but for something with even a moderate correlation to SPY it feels like pretty weak performance. I’m going to be knocking CROP off my list. Despite what initially appeared to be solid diversification benefits when combined with SPY, there have been no other positives outside of the discount to NAV. While I like buying an ETF at a discount to NAV, it needs to be an ETF that I actually want to own. Additional disclosure: Information in this article represents the opinion of the analyst. All statements are represented as opinions, rather than facts, and should not be construed as advice to buy or sell a security. Ratings of “outperform” and “underperform” reflect the analyst’s estimation of a divergence between the market value for a security and the price that would be appropriate given the potential for risks and returns relative to other securities. The analyst does not know your particular objectives for returns or constraints upon investing. All investors are encouraged to do their own research before making any investment decision. Information is regularly obtained from Yahoo Finance, Google Finance, and SEC Database. If Yahoo, Google, or the SEC database contained faulty or old information it could be incorporated into my analysis. The analyst holds a diversified portfolio including mutual funds or index funds which may include a small long exposure to the stock.

Most Countries Still Oversold

The action in global stocks over the last few days has left 25 of the 30 largest country ETFs in oversold territory. Below is our trading range screen highlighting the trend. For each ETF in the screen below, the black vertical “N” line represents its 50-day moving average. Moves into the red zone are considered “overbought”, while moves into the green zone are considered “oversold”. Throughout this bull market, oversold levels have generally offered up good buying opportunities, but there’s always the risk that the “buy the dip” trade will finally fail to pan out. The only country ETF on the list that is currently in overbought territory is FXI (China). Two others – Phillipines (NYSEARCA: EPHE ) and Turkey (NYSEARCA: TUR ) – are above their 50-day moving averages, while South Africa (NYSEARCA: EZA ) and the US (NYSEARCA: SPY ) are below their 50-days but not oversold. Some of the most oversold countries at the moment include France (NYSEARCA: EWQ ), Italy (NYSEARCA: EWI ), Spain (NYSEARCA: EWP ), Sweden (NYSEARCA: EWD ), Switzerland (NYSEARCA: EWL ) and the UK (NYSEARCA: EWU ) – all Euro-area markets. Just a few countries are in the green for the year, while most are down in the 1-3% range. Some of the country ETFs that have already seen 4%+ declines in 2015 include Canada (NYSEARCA: EWC ), Italy ( EWI ), Malaysia (NYSEARCA: EWM ), France ( EWQ ) and Colombia (NYSEARCA: GXG ). While the Russian ETF (NYSEARCA: RSX ) is still 20% below its 50-day, it’s actually one of the few countries that’s up on the year. Now that you’ve read this, are you Bullish or Bearish on ? Bullish Bearish Sentiment on ( ) Thanks for sharing your thoughts. Why are you ? Submit & View Results Skip to results » Share this article with a colleague

In Search Of Income: Covered Call CEFs (Part II – Specific Funds)

Summary There are 20+ covered call CEFs that Convergence Investments considers potentially investable. Funds can be measured and should be evaluated based on income generation, NAV performance, valuation, and a variety of other factors. We currently find BDJ, ETJ, and NFJ to be well balanced, attractive funds worthy of investor consideration. Our previous article profiled and analyzed the sector of closed-end funds that utilize covered call strategies. Please refer to that article for a background description on the sector as a whole. This article will dig deeper into specific recommendations of especially attractive covered call CEFs for income-seeking investors to consider. Universe of Included Funds The Convergence investing universe consists of more than 475 closed-end funds across all available equity and bond sectors, after filtering for funds that we consider not investable for a variety of reasons (the most common being size/liquidity, NAV transparency). The covered call segment consists of the following closed-end funds: BlackRock Enhanced Equity Dividend Trust (NYSE: BDJ ) BlackRock International Growth & Income Trust (NYSE: BGY ) BlackRock Global Opportunities Equity Trust (NYSE: BOE ) BlackRock Enhanced Capital & Income Fund (NYSE: CII ) Eaton Vance Enhanced Equity Income Fund (NYSE: EOI ) Eaton Vance Enhanced Equity Income Fund II (NYSE: EOS ) Eaton Vance Risk-Managed Diversified Equity Income Fund (NYSE: ETJ ) Eaton Vance Tax-Managed Buy-Write Opportunities Fund (NYSE: ETV ) Eaton Vance Tax-Managed Global Buy-Write Opportunities Fund (NYSE: ETW ) Eaton Vance Tax-Managed Diversified Equity Income Fund (NYSE: ETY ) Eaton Vance Tax-Managed Global Diversified Equity Income Fund (NYSE: EXG ) First Trust Enhanced Equity Income Fund (NYSE: FFA ) GAMCO Natural Resources Gold & Income Trust (NYSE: GNT ) Guggenheim Enhanced Equity Income Fund (NYSE: GPM ) ING Global Advantage & Premium Opportunity Fund (NYSE: IGA ) ING Global Equity Dividend & Premium Opportunity Fund (NYSE: IGD ) Cohen & Steers Global Income Builder (NYSE: INB ) Voya Natural Resources Equity Income Fund (NYSE: IRR ) Madison Covered Call & Equity Strategy Fund (NYSE: MCN ) Madison Strategic Sector Premium Fund (NYSE: MSP ) NFJ Dividend & Premium Strategy Fund (NYSE: NFJ ) Columbia Seligman Premium Technology Growth Fund (NYSE: STK ) Evaluating Investment in Covered Call Funds There are many qualitative and quantitative factors that prospective investors can consider when evaluating a closed-end fund. Convergence Investments summarizes these many factors into six dimensions useful for comparing and choosing investments: Distribution Yield – How much – and what type(s) – of distribution (aka “yield”) does the fund offer? How likely is it that the fund can maintain or increase this distribution in future? NAV Performance – How has a sector’s or individual fund’s NAV changed in the recent past? What is the outlook for future NAV trends? Valuation – Where is the current market price relative to current NAV for a fund or sector? How does this premium (or discount) to NAV compare to the past and to other fund categories? Risk – What level and type of risk is an investor bearing to earn distributions and potential capital gains? Stewardship – Does a fund have strong management? Are its management fees reasonable? Does the board have shareholder-friendly policies in place? Tradability – How readily can we take a position (long or short) in a particular fund? What are the liquidity (market cap, average daily volume) and trading costs (average spreads, short borrow fees) involved? Distribution Yield Significant distribution yields are among the top motivators for closed-end fund investors. While there are many nuances to fund distributions, including how they’re generated and how sustainable they appear to be, the top-line yield number drives much of the sentiment and investor behavior. Generally, funds within the segment offer a NAV yield* of between 6 and 10%. However, investors seeking superior yield within the this sector may give special consideration to NFJ, STK, GPM, or IRR, all of which boast distribution yields of greater than 10% of NAV. *Note that numbers quoted here are calculated as a percentage of NAV rather than market price to provide a more accurate measure of the income generated from portfolio assets. Investors holding closed-end funds at a discount to NAV will earn yields greater than the NAV yields. For instance, a fund trading at a 10% discount will have a price yield of 10/9 ths or 1.11x the NAV yield. (click to enlarge) Seasoned CEF investors know that distribution rates (often referred to as “yield”) are not all created equal. The source of distributions matters as much as the size of distributions in determining the attractiveness of the income stream generated by a given fund. In the case of covered call CEFs, return of capital (ROC) is quite common and, in our view, is usually a positive – or at least neutral – feature of a fund. Please see our previous article for further explanation. The below chart ranks each covered call fund by the estimated** effective tax rate on distributions in the past 12 months for a hypothetical taxpayer based on the allocation of each fund’s distributions to the four buckets of distributions: ROC, long-term gains, short-term gains, or income. The author is not a tax expert. This analysis is for illustrative purposes only and does not constitute tax advice. It’s somewhat surprising how widely the effective tax rates vary for the funds, at least in the current period. Note that ROC distributions have the effect of lowering cost basis and thus trigger increased capital gains upon eventual sale of the fund. Certain funds, such as GNT, may have low effective tax rates in part because they have declined substantially in NAV so may be selling positions at a capital loss. However, other funds like EXG which have also eroded NAV in the past year and purport to be tax managed, had distributions taxed at effective rates of upwards of 40% in this hypothetical case. Categorization of distributions can change dramatically from year to year so do not treat this analysis as anything other than an illustration of the importance of carefully monitoring changes to the taxation status of your funds’ distributions. (click to enlarge) **This estimate assumes a California married-filing-jointly household with AGI of $400,000 with tax rates as follows: ROC is tax free (note: ROC reduces cost basis and will trigger increased taxable gains upon sale of the fund) Long-term gains are taxed at 29.1% (15% federal, 10.3% state, 3.8% NII) Short-term gains and income are taxed at 47.1% (33% federal, 10.3% state, 3.8% NII) NAV Performance Investors disagree about how to interpret recent increases in net asset value. Momentum-oriented investors may see this as a trend likely to continue while mean reversion investors may see exactly the opposite. Convergence generally views recent increases in NAV as a positive factor at both the sector and fund level because we believe that sentiment-driven fund flows tend to play out over months and quarters, not days and weeks. We also view increasing NAV as an indicator of manager skill and of protection against cuts to a fund’s distribution. Covered call funds have varied widely in the past 12 months with some funds like GNT, IRR, and BGY falling more than 15% in the past year while others like STK, FFA, and EOS have grown NAV by 5+ percent. (click to enlarge) Valuation A major reason to invest in closed-end funds rather than ETFs or traditional mutual funds is the possibility for informed investors to take advantage disconnects between fund price and fund NAV, often referred to as the fund’s premium or discount. We seek to purchase funds at sizeable discounts, and ideally at discounts beyond that which is normal relative to history and/or relative to a fund’s peers in category. Purchasing at a discount offers two attractions. First, purchasing at a discount enhances yields since an investor can own the rights to the income generated from a hypothetical $10 of net assets with only $9 of investment. Second, for investors willing to actively manage their holdings, funds purchased at particularly wide discounts can be sold at narrower discounts – or even premiums – for capital gains that enhance the total returns from a fund. Note: Convergence follows the convention of representing all premiums (price > NAV) as a positive number and all discounts (price < NAV) as a negative value. Among the funds in this sector all but two trade at discounts to NAV, and several including MSP, BOE, MCN, BDJ, BGY, and IGD, trade at double-digit discounts. It's worth noting that deep discounts have not always been the rule in this fund category, with the group in aggregate priced at a premium to NAV as recently as mid-2010. (click to enlarge) Risk There are no free lunches. Covered call CEFs offer high single-digit or even double-digit yields to investors as compensation for the various risks that investors are being asked to take. Covered call CEFs most significantly expose investors to equity market risk, measured by "beta" to the broader S&P 500 index. We believe this metric is most useful when comparing day-to-day measurements of NAV, rather than price, vs. the broader market to accurately measure how much market risk the portfolio itself is exposed to. While all funds in the category have a beta less than 1.0 (i.e., are relatively less sensitive to market volatility than an S&P 500 index fund), certain funds such as ETJ, IRR, and MSP carry beta factors below 0.7 and may be suited to investors looking to avoid equity market risk. (click to enlarge) A second type of risk to which covered call CEF investors are exposed is concentration risk , or the lack of diversification within the portfolio's holdings. To some investors, concentration in a single sector (e.g., Financials) may be a feature rather than a bug. Seligman's STK, after all, is a top performing fund in part because it's concentrated in technology stocks. However, most investors will prefer diversification to concentration. The below chart illustrates each fund's concentration of holdings in seven major sectors and ranks (from top to bottom) concentration, calculated in a manner similar to the Herfindahl Index from the field of antitrust law. Almost all funds in the category are well diversified but investors should be aware that IRR, STK, and GNT all carry specific investment mandates that must be suited to their needs and beliefs. (click to enlarge) Expenses Expense ratios are almost universally accepted as an important criteria in fund selection. However, the unique structure of closed-end funds makes the calculation of relevant expense ratios non-trivial. Convergence favors using a measure of management fees, excluding cost of leverage, as a percent of gross assets instead of the typically higher ratio that complies with "40 act" reporting requirements. In our opinion, the ability of CEFs to use leverage with borrowing costs far below what we would pay a broker is to our benefit and cost of capital borrowed for investors' benefit should not be a strike against fund managers. Further, we believe that measuring the expense ratio we pay to fund managers per dollar of portfolio assets they are managing is a more fair way of measuring value-for-money when comparing fees among CEFs or when comparing CEFs to unlevered structures like mutual funds and ETFs. All funds in this category charge fees of between 0.8% and 1.25% per annum, which we believe to be reasonable in consideration of the relatively active nature of covered call strategies. (click to enlarge) Liquidity Liquidity, or how easily an investor is able to find a willing counter-party to a buy or sell transaction, is a metric whose importance varies greatly by individual investor. On one extreme, an investor purchasing only a few hundred shares of a fund with intentions of holding for months or years should care very little about liquidity. However, investors trading in moderate to large quantities, and with intentions of medium to short holding periods, should begin to consider fund liquidity as an important hidden cost to investment. Funds including MSP and MCN are illiquid enough that even relatively modestly sized trades may represent a meaningful share of daily market volume. Investors should exercise caution with lower liquidity funds, potentially limiting total investment and scaling in/out of positions in small volumes. (click to enlarge) Conclusion As this article has outlined, there are many dimensions on which you may compare funds. However, we highlight three funds of interest based on their across-the-board attractiveness. BlackRock Enhanced Equity Dividend Founded 10 years ago, the current management has been in place since 2010. Its portfolio of holdings can be characterized as blue chip. Recent changes in the source of distributions from ROC to income and more recently back to primarily ROC may have contributed to the discount to NAV to widen to a very attractive 12%. We believe the stewardship is strong with management fees below 1% and absence of a managed distribution policy. It offers a dividend reinvestment plan which has all dividends and distributions reinvested in shares unless otherwise directed. EV Risk-Managed Diversified Equity This fund distributes an annualized 10%+ monthly based on a NAV which is discounted nearly 12% in current trading, though recent performance has lagged behind peers. Unlike many of its peers, recent distributions have been largely characterized as income rather than ROC. It has a funds reinvestment policy that, unless the shareholder directs otherwise, all distributions will be reinvested. As is typical of the segment, it carries no leverage. Its holdings are fully invested in large US equities. AllianzGI NFJ Dividend Interest & Premium This fund seeks to pay current income while producing capital appreciation. It distributes at a rate of 11% which has recently been characterized primarily as ROC so as to minimize tax impact. It has a history of trading near NAV, making the current ~8% discount to NAV an attractive entry point. The fund is somewhat concentrated in financials (23%) and energy (14%) which may explain the recent widening of discount. Over 10% of assets are in foreign stocks. Management fees are slightly less than 1% and its historically successful portfolio managers have been in place since the fund's inception in 2005. Additional disclosure: Convergence Investment Management may recommend various securities included within this article for inclusion for individual client portfolios. These recommendations may change at any time and are specific to the individual client's objectives and risk tolerance.