Tag Archives: seeking

ETF Allocation When Stocks Are Stuck In A Moment
The long-term CAPE average is 16.5. Today’s CAPE is north of 27. CAPE ratios above 27 have only occurred in the months around 1929, 1999 and 2007. I believe that we are closer to the next “common sense” recession than we are to extraordinary acceleration of the U.S economy. The cyclically-adjusted price-to-earnings ratio (a.k.a CAPE, P/E10, Shiller’s P/E) evaluates the average inflation-adjusted earnings for the S&P 500 over the previous 10 years. The long-term CAPE average is 16.5. Today’s CAPE is north of 27. And despite numerous detractors on its predictive value, P/E10 led directly to a Nobel Prize for its creator, Robert Shiller. With 140 years of market data, CAPE ratios above 27 have only occurred in the months around 1929, 1999 and 2007. Equally worthy of note, the Nobel economist’s work accurately identified the bursting of the dot-com bubble (1999-2000) as well as the collapse of the financial system (2007-2008). Unfortunately for those who might like to argue why Shiller’s valuation methodology is irrelevant in 2015, U.S. stock prices are expensive whether you compare them to trailing 12 month earnings, forward 12 month earnings (being revised in light of the energy sector), book value and cash flow. Granted, one can suggest that zero percent rate policy makes Shiller’s P/E impotent; heck, those ridiculously low yields across the curve may make every traditional valuation metric worthless. Still, the more probable set of circumstances is that a bear market in equities is not too far off and that traditional valuation still has at least a single seat at the NYSE. Indeed, if global interest rates continue to decline, strong corporations may do the same thing that they have been doing for the past six years; that is, they may issue low rate investment grade debt and use the funds to repurchase shares of corporate stock. That activity boosts the “E” in company earnings. I still believe this activity will keep equities from dropping off a cliff in the shorter-term. If nothing else, it is largely responsible for keeping the heralded index range-bound for the better part of the last 10 weeks. Looked at another way, why would CEOs commit capital to major projects or human resources right now? The strong dollar is killing exports, weaker foreign currencies are hurting profits, global deflation is hindering sales and volatile oil prices are increasing geopolitical risks. The “go-to” move of share buybacks may very well be the primary driver that keeps the S&P 500 from falling out of bed. We should be cognizant, however, that stock buybacks for the S&P 500 are already approaching the record highs set in mid-2007. Is that a good thing? Or does it merely mask the declining sales and increasing debt of the companies that engage in the practice for too long? On the other side of the coin is the reality that bear markets are inevitable. So I decided to conduct a little exercise. What if the S&P 500 fell an average bear market percentage drop from its 2093 perch? If you split the difference between the average bearish descent since 1926 (35%) and the median plunge since 1871 (38%), the S&P 500 would bottom out near 1330. Let’s take that prospect a step further. The total return for the SPDR S&P 500 Trust ETF (NYSEARCA: SPY ) with dividends reinvested would come in around 17.5% for the first 14-plus years of the 21st century, representing an approximate compounded return of 1.2%. Of course, this would only occur if you had bought-n-held-hoped through all of the downturns – 2000-2002, 2007-2009, 2011, 2015. It gets worse. A 17.5% total return (1.2% compounded) looks even meeker up against an investment grade bond fund like PIMCO Total Return Fund (MUTF: PTTDX ). Assuming an absence of safe haven buying in the hypothetical bearish downturn and using just the performance numbers to date, the fund’s 160% since December 31, 1999 represents 7% annualized. That is for investment grade bonds, folks. “But Gary,” you protest. “You’re speaking in hypothetical scenarios. The return for SPY so far is actually 4.5% at a total return of 85%.” Fair enough. My questions to dismiss the thought process, then, are: (1) Do you believe that bear markets have been removed from the stock investing landscape and, (2) If you do believe in 30%-plus erosion of capital, what is your plan to minimize the damage? The way that I see it, central banks cannot eliminate the inevitability of recessions or bear markets. Moreover, I believe that we are closer to the next “common sense” recession than we are to extraordinary acceleration of the U.S economy. It follows that I have to prepare for the high likelihood of changes ahead. In an investing environment that – by most measures – is becoming increasingly fearful, I emphasize ETF assets on the far left and far right of the risk spectrum . On the right, I will maintain an allegiance to funds like the iShares MSCI USA Minimum Volatility ETF (NYSEARCA: USMV ), the Vanguard High Dividend Yield ETF (NYSEARCA: VYM ) and the Health Care Select Sect SPDR ETF (NYSEARCA: XLV ). They have given me little reason to cut back in that arena. I have even added a modest amount of stock risk to European exporters that might benefit from euro weakness via the iShares Currency Hedged MSCI Germany ETF (NYSEARCA: HEWG ). On the left, I remain dedicated to risk averse assets as I have throughout the prior 14 months. Long duration treasuries have provided remarkable relative value in a world where inferior country debt offers less yield than U.S. debt. I continue to be long ETFs like the Vanguard Extended Duration Treasury ETF (NYSEARCA: EDV ) and the iShares 20+ Year Treasury Bond ETF (NYSEARCA: TLT ). Taxable accounts have a variety of muni possibilities from the iShares National AMT-Free Muni Bond ETF (NYSEARCA: MUB ) to the BlackRock MuniAssets Fund (NYSE: MUA ). Perhaps most importantly, if a stock bear should be around the bend, I am able to use the FTSE Custom Multi-Asset Stock Hedge Index to my advantage. Not only did I join FTSE-Russell in creating the index that many are calling “MASH,” but I recognize the necessity of owning a diverse group of asset types to hedge against an extreme downturn in stocks. Long-dated treasuries, munis, gold, the Swiss Franc, the yen, the dollar, JGBs, German bunds, TIPS and zero coupons figure prominently in the index. Nobody knows when a bear market will emerge. Yet failing to prepare for a catastrophic decline is the worst mistake an investor can make. If nothing else, investors should recognize that the collapse in commodities, never-before-seen lows in global yields and the rapid appreciation of the almighty buck are more indicative of “risk-off” money movement than “risk-on” excitement. Disclosure: Gary Gordon, MS, CFP is the president of Pacific Park Financial, Inc., a Registered Investment Adviser with the SEC. Gary Gordon, Pacific Park Financial, Inc, and/or its clients may hold positions in the ETFs, mutual funds, and/or any investment asset mentioned above. The commentary does not constitute individualized investment advice. The opinions offered herein are not personalized recommendations to buy, sell or hold securities. At times, issuers of exchange-traded products compensate Pacific Park Financial, Inc. or its subsidiaries for advertising at the ETF Expert web site. ETF Expert content is created independently of any advertising relationships.
To Hedge Or Not To Hedge?

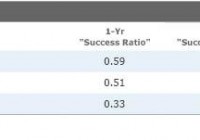
This is an updated version of an ETF Specialist originally published on Feb. 19, 2014. Currency-hedged exchange-traded funds have come into vogue of late in the United States. Investor interest was first piqued by the performance of the oldest and largest of them all: WisdomTree Japan Hedged Equity (NYSEARCA: DXJ ) . The fund owns a portfolio of dividend-paying Japanese stocks that generate more than 80% of their revenue outside of Japan. It gained nearly 42% in 2013, as a massive dose of monetary stimulus contributed to an 18% decline in the value of the Japanese yen, and steady improvement in the global economy gave Japan’s stock market an additional boost. In contrast, iShares MSCI Japan ETF (NYSEARCA: EWJ ) , which tracks a standard market-cap-weighted benchmark and does not hedge its yen exposure, increased by 26% in 2013. Clearly, it paid for U.S. investors in Japanese stocks to have a hedge against a declining yen over this span. But was this a flash in the pan, or do currency hedges have value over longer time frames? With the U.S. dollar marching steadily higher–thanks in part to (relatively) attractive interest rates–and double-digit moves in major currencies making headlines, now is a good time for investors to explore these questions. Back to Basics: Return, Risk, and the Practicalities of Putting a Currency Hedge in Place In simple terms, a domestic investor’s local-currency-denominated return in a foreign security (or a portfolio of them) is equal to the foreign security’s (or portfolio’s) return plus the foreign currency return, plus the product of the foreign security return and the foreign currency return. The last part of this equation accounts for the interplay between the two, and as it is the product of these two figures, its contribution to the overall return will grow as either the foreign asset return or the foreign security return grows larger. Domestic Currency Return = Foreign Security Return + Foreign Currency Return + (Foreign Security Return x Foreign Currency Return) The effect of fluctuating exchange rates can either help or hurt returns. In the case of U.S. investors holding Japanese stocks, the yen’s depreciation hurt the U.S. dollar return for unhedged investors in 2013, as evidenced in part by the iShares fund’s relative underperformance versus the WisdomTree offering. In another extreme example, the 34% appreciation of the Brazilian real contributed to the 124% calendar-year return posted by iShares MSCI Brazil Capped ETF (NYSEARCA: EWZ ) in 2009. These examples highlight that currency effects can be extreme in magnitude. It’s also important to consider currencies’ effect on the risk of a portfolio of foreign securities: The expression for the variance (the square root of which is the standard deviation) of a foreign security or portfolio’s returns is as follows: σ 2 $ = σ 2 LC + σ 2 S + 2σ LC σ S ρ LC,S, where σ 2 $ = the variance of the foreign asset returns in U.S. dollar terms; σ 2 LC = the variance of the foreign asset in local-currency terms; σ LC = the standard deviation of the foreign asset in local-currency terms; 2 S = the variance of the foreign currency; σ s = the standard deviation of the foreign currency; ρ LC,S = the correlation between the returns of the foreign asset in local-currency terms and movements in the foreign currency. This expression demonstrates that the volatility of a foreign asset in domestic-currency terms is directly related to the volatility of the asset in local-currency terms (the first term in the expression) and the volatility of the foreign currency (the second term). It also shows that the higher the correlation between the foreign asset in local-currency terms and movements in the foreign currency, the greater the variance will be in local currency terms. (Again, take the square root and you’ll get the standard deviation.) Hedging away currency exposure will reduce risk, as measured by standard deviation–as can be seen in Exhibit 3 below. How does currency hedging work in practice? Most currency-hedged ETFs will use currency forward contracts to reduce their foreign-currency exposure. A currency forward contract is an agreement between two parties to buy or sell a prespecified amount of a currency at some point in the future (typically one month out in the case of currency-hedged ETFs) at an exchange rate agreed upon between the two parties. Because the value of the forward contract is fixed ahead of time, and the value of the fund will fluctuate during the course of a month as asset prices and cash flows into and out of the fund fluctuate, the forward may not be a perfect hedge. It’s also important to note that these hedges come at a cost, though their price tag typically amounts to just a few basis points in the case of developed-markets currencies in stable interest-rate environments. FX Effects It is useful to look at historical data to frame the effects of currency hedging on investment performance (for U.S. investors in this case). There are two key elements to consider when assessing the effects of currencies on equity portfolios: their contribution to return (as covered above) and their contribution to risk. Exhibit 1 shows “success ratios” for a trio of MSCI benchmarks over the 20-year period ended Jan. 31, 2015. These benchmarks are all tracked by one or more currency-hedged (and unhedged) ETFs. The success ratio represents the portion of the overlapping monthly rolling one-, three-, and five-year periods over these two decades during which the unhedged version of the index outperformed its fully hedged counterpart. For example, the MSCI EAFE Index outperformed its fully hedged counterpart in 59% of these overlapping rolling one-year periods over this 20-year span. In hindsight, in the case of the MSCI EAFE and MSCI Germany benchmarks, the winner could have been predicted by the flip of a (mostly) fair coin. The story is different when it comes to the MSCI Japan Index, where “getting the yen out” has clearly paid off more often than not. Exhibit 2 contains the annualized average returns for each benchmark across each of the overlapping monthly rolling one-, three-, and five-year periods dating back 20 years from the end of January 2015. The differences in relative performance vary between the hedged and unhedged versions of these indexes depending on the length of the measurement period. The MSCI Japan Index is again a unique case, as evidenced by the yawning performance differential between its hedged and unhedged versions. What about risk? Currency risk is a significant contributor to overall risk in the context of a foreign-equity portfolio. Exhibit 3 shows the trailing 20-year annualized standard deviations and Sharpe ratios for the same benchmarks featured in the first two exhibits. In the case of all three benchmarks, it is clear–as evidenced by the difference in Sharpe ratios between the U.S. dollar and hedged versions of the indexes–that currency exposure is a meaningful source of risk, currency hedging can serve to mitigate this risk, and it may ultimately result in superior risk-adjusted performance. To Hedge or Not to Hedge? The best answer to the question of whether it makes sense to hedge the currency exposure of an international-stock portfolio is this: It depends. By hedging foreign-currency exposure, investors can mitigate a source of risk–but at the expense of a potential source of return. The trade-off between the two is important, and investors’ decisions will depend on a variety of factors, including but not limited to their return requirements, risk tolerance, investment horizon, and the costs associated with hedging currency exposure. Disclosure: Morningstar, Inc. licenses its indexes to institutions for a variety of reasons, including the creation of investment products and the benchmarking of existing products. When licensing indexes for the creation or benchmarking of investment products, Morningstar receives fees that are mainly based on fund assets under management. As of Sept. 30, 2012, AlphaPro Management, BlackRock Asset Management, First Asset, First Trust, Invesco, Merrill Lynch, Northern Trust, Nuveen, and Van Eck license one or more Morningstar indexes for this purpose. These investment products are not sponsored, issued, marketed, or sold by Morningstar. Morningstar does not make any representation regarding the advisability of investing in any investment product based on or benchmarked against a Morningstar index.

Why Value Works: Low Trading Volume

One aspect or explanation why value works is the low trading volume, which is often typical for companies in which we invest. A new paper by Roger Ibbotson and Thomas Idzorek , who work for GMO, a fund management group where James Montier works as well, in the Journal of Portfolio Management, which analysed 40 years of stock returns by putting them into a perspective to the average trading volume of the last year. The paper finds stocks in the least popular quartile outperformed those in the most popular segment by seven percent. In their paper “Dimensions of Popularity,” Ibbotson and Idzorek identify the most common market premiums and anomalies, such as: Small cap – Smaller capitalization stocks outperform larger capitalization stocks Valuation – Value companies beat growth companies Liquidity – Less liquid stocks beat those with more liquidity Momentum – Stocks trending up will continue to trend up Because the risk-return framework does not explain all these premiums and anomalies seen in the market, the researchers propose the unifying “theory of popularity.” The authors explain that the most common market premiums and anomalies are associated with a stock’s popularity or unpopularity. For example, if investors “vote with their dollars,” small cap companies have gotten fewer votes. Value companies commonly have something wrong with them, which makes them unpopular. If an asset has characteristics that investors really dislike, such as low liquidity, little name recognition, or high volatility, its price will be lower and therefore its expected future returns will be higher, all other things being equal. According to the theory of popularity, if an investor were to rank stocks by popularity, he or she could buy a basket of unpopular stocks and systematically rebalance as the stocks become more popular by buying a new portfolio of relatively less popular stocks. As some of the stocks in the portfolio become more popular over time, they become more valuable and the investor will see appreciation. This cycle happens normally in Deep Value situations where trends tend to revert to the mean. “Risk has become a catch-all for all of the attributes that investors do not like, but riskiness does not explain all the anomalies we see in the market. Value premiums are a perfect example. Stocks with low market-to-book ratios or low price-earnings ratios are not necessarily more volatile or less liquid, but we know that over time value stocks beat growth stocks. We need a new model for explaining investment performance that goes beyond risk and return. Popularity may be a better lens through which to view investment behavior,” Ibbotson said. “Many of the well-known market premiums are associated with unpopular stocks. Unpopular stocks tend to be smaller, less liquid, and perceived as lacking growth potential. These stocks, with their low relative prices, may offer investors better future performance as they move along the spectrum toward popularity.” Have a good week. Share this article with a colleague