Tag Archives: seeking

Tap China’s Bond Market With 3 New ETFs
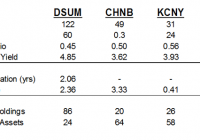
Summary Three new ETFs open up China’s onshore bond market to individual investors. CBON offers a longer duration portfolio and a lower yield due to China’s flat yield curve; CHNB has shorter maturity and higher yield. KCNY has the highest yield and shortest duration of the three new funds, but it still yields less than DSUM, a 3-year-old fund covering the offshore bond market. A small opening in China’s bond market led to a flurry of activity in the ETF world last year, with three Chinese bond ETFs launching in late 2014. These new funds are trying to grab market share from the largest Chinese offshore bond ETF, the PowerShares Chinese Yuan Dim Sum Bond ETF (NYSEARCA: DSUM ), which has faced little competition since its launch in 2011. Dim sum bonds are renminbi-denominated bonds that trade offshore. Issuers are usually Chinese firms, but there are also foreign companies that have issued renminbi bonds, including McDonald’s (NYSE: MCD ). The market for new dim sum bonds has shrunk in 2015 as traders increasingly expect a weaker Chinese yuan. Interest rates on interbank loans using offshore yuan in Hong Kong have tripled from last year while average interest rates on yuan bonds have risen 30 percent. Last year, Chinese government bonds sold at a premium in Hong Kong; this year, they sell at a discount due to investors’ expectations of weaker yuan. Borrowers have been opting for U.S. dollar bonds instead due to lowering borrowing costs. Offshore bond investors are also more wary of Chinese debt given the situation with Chinese developer Kaisa. The firm missed a loan and a bond payment, and recently found a white knight that will rescue it, pending everything goes well. However, the firm still may need to restructure its debt , and offshore bond holders are last in line unable to take the quick legal action available to mainland creditors who have already successfully frozen Kaisa’s assets. The bonds in this case are U.S. dollar denominated, but it highlights the risk for foreign investors who are now demanding higher interest payments. The newer funds, the Global X GF China Bond ETF (NYSEARCA: CHNB ), the KraneShares E Fund China Commercial Paper ETF (NYSEARCA: KCNY ), and the Market Vectors ChinaAMC China Bond ETF (NYSEARCA: CBON ), all offer exposure to onshore bonds traded on mainland exchanges in China. While the funds offer direct access, it comes through partnering with firms that are RQFII (renminbi-qualified foreign institutional investors). Most likely, China will open its markets faster than these funds attract assets, but if not, it’s possible the funds could run into quota limits. All three firms use sub-advisors: GF International, China AMC, and E Fund, as noted in the funds’ names. The Chinese bond market is not completely open to foreign investors yet, and the number of securities available to these funds is limited. All three have more than 50 percent of assets in the top 10 holdings and the number of holdings ranges from 20 to 33, an extremely small number for a bond fund. Here’s more data from the provider websites: DSUM , KCNY , CBON , CHNB . (click to enlarge) Currently, the main risk faced by these bonds is credit risk and depreciation in the Chinese yuan. The Chinese currency is effectively pegged to the U.S. dollar, and official policy is to maintain a stable currency. Nevertheless, each time China’s forex reserves have fallen, the currency has weakened. Chinese reserves peaked in June of last year and pressure on the yuan has been rising as Chinese investors increasingly move capital abroad, thanks in part to reforms that have opened up the financial system. Chinese investors swap yuan for dollars and invest abroad, causing the yuan to drop. They are also swapping yuan for dollars and immediately buying yuan in Hong Kong because the offshore yuan is cheaper. This arbitrage also causes the forex reserves of China to decline. Tight credit conditions in China have pushed yields higher on many forms of debt, as has been seen in the dim sum bond market. The People’s Bank of China (PBOC) might lower interest rates this year to help the slowing Chinese economy, a widely expected move following weaker-than-expected trade data from January. A cut in interest rates would be good news for bond investors hoping for capital gains, but it could also increase the depreciation pressure on the yuan. As for credit risk, all three of the onshore funds hold state-owned and government debt unlikely to default. Conclusion This doesn’t appear to be the best time to buy Chinese debt, but for investors who are long-term bullish on China and the yuan, these are funds to keep an eye on. All three could be winners in the long run as China opens its capital account and the yuan plays a larger role in global finance. Investors who expect a rising or stable yuan in the near term should consider the funds right now since the PBOC might ease as soon as March and these funds could see capital gains as yields decline. For investors interested in liquidity and yield, DSUM is the best choice. It’s diversified, yields nearly 5 percent, and shares are actively traded. For investors who want to bet on a cut in rates, the higher-duration CBON is a better choice. Shares aren’t as heavily traded, so investors need to watch the bid/ask spread and deviation from NAV. From a risk/reward perspective, KCNY appears the best bet as it holds short-term commercial paper. China’s yield curve is flat at the moment, and investors can receive a relatively high yield for such a low-duration portfolio. Disclosure: The author has no positions in any stocks mentioned, and no plans to initiate any positions within the next 72 hours. (More…) The author wrote this article themselves, and it expresses their own opinions. The author is not receiving compensation for it (other than from Seeking Alpha). The author has no business relationship with any company whose stock is mentioned in this article.
Excessive Bullishness Toward Gold Points To A Retreat

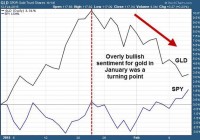
By Ronald Delegge Sentiment extremes, regardless of whether they’re bullish or bearish, invariably point to a readjustment in prices. This undeniable truth applies to all asset classes in all time frames. Nothing is immune to the forces of crowd behavior (see Beanie Babies and Pokemon cards). On Jan.23, 2015 the Wall Street Journal declared “Buyers Take a Shine to Metals Again.” When this headline was published, the SPDR Gold Trust ETF (NYSEARCA: GLD ), which follows the price of gold bullion, had jumped 9.38% against a modest loss of 0.28% for the S&P 500. Since Aug. 2011, gold prices have crashed 28%, so naturally, enthusiasm for a rally – especially among survivalists and Peter Schiff groupies, has been building. The WSJ article correctly observed how the amount of gold owned by exchange-traded products (ETPs) jumped by more than 1.2 million ounces in January, making it the biggest increase since Aug. 2012. Likewise, silver coins sales have been rising. (click to enlarge) Just as bullish enthusiasm for gold was peaking, the Feb. 2015 ETF Profit Strategy Newsletter (released on 1/24/15) alerted readers: Ahead of a potential pullback, we’re buying the ProShares UltraShort Gold (NYSEARCA: GLL ) at $83.75 up to a buy limit of $84.25. GLL aims for double daily opposite performance to gold bullion. Our tandem options trade is to buy the GLD MAR 2015 124 put options (GLD150320P00124000) at $350 up to a buy limit of $375. We bagged a +32% one-week gain on the GLD calls and our GLL position is already +10% higher from where we bought it. Not only did we understand the market dynamic of sentiment extremes, but we took advantage of it. These principles used in conjunction with technicals can be applied in any market, not just metals. The chart above illustrates how capitalizing on short term overly bullish extremes in gold has been great for contrarian traders. The red dotted line coincides with GLD’s yearly top (so far) and is where we executed our bearish gold trade. It also reinforces an age old truth: Do the opposite of the crowd and you’ll always get what they wish they had. Disclosure: No positions Link to the original article on ETFguide.com

EOI Vs. EOS: Not Much Difference Between These CEFs

Summary On the surface, the biggest difference between Eaton Vance’s EOI and EOS appears to be the Roman numeral in EOS’ name. There are, really, more differences when you dig a little bit deeper. In the end, however, the differences aren’t big enough. Eaton Vance has a collection of closed-end funds, or CEFs, that have confusingly similar names. I recently wrote about Eaton Vance Tax-Managed Buy-Write Opportunities Fund (NYSE: ETV ) and Eaton Vance Tax-Managed Buy-Write Income Fund (NYSE: ETB ). The difference between these two funds boils down to the word ” opportunities .” With Eaton Vance Enhanced Equity Income Fund (NYSE: EOI ) and Eaton Vance Enhanced Equity Income Fund II (NYSE: EOS ), there’s even less of a hint at what the difference might be. The same… Other than the names of EOI and EOS being differentiated by little more than a single Roman numeral, there are other confusing similarities that you’ll need to wade through. For example, word for word, the two funds’ objectives are: “The Fund’s primary investment objective is to provide current income, with a secondary objective of capital appreciation.” In fact, the marketing material for each fund provides identical “fund highlights,” as well: The Fund invests in a portfolio of primarily large- and midcap securities that the investment adviser believes have above-average growth and financial strength and writes call options on individual securities to generate current earnings from the option premium. The Fund pays monthly distributions to shareholders pursuant to a managed distribution plan. Meanwhile, they both IPOed within a three month span between late 2004 and early 2005. It looks like Eaton Vance used copy and paste when it introduced these two funds. …But different So, on some level, these two CEFs are very similar offerings. In fact, the managers on EOI are also on EOS, though there are two additional managers rounding out the crew on EOS. And even when you look at the two portfolios, similarities remain. For example, Apple (NASDAQ: AAPL ), Google (NASDAQ: GOOG ) (NASDAQ: GOOGL ), Amazon (NASDAQ: AMZN ), and Microsoft (NASDAQ: MSFT ), taken as a group, account for well over 10% of each fund. And both portfolios have options written on around 45% of their portfolios. But there’s an important distinction between the two funds that starts to show up when you look more closely at the top holdings and more broadly at the overall portfolio. For example, although the four technology stocks above are all heavily represented in the top ten of each portfolio, they are, in fact, weighted differently. Why? Likely because EOI is benchmarked against the S&P 500 Index while EOS is benchmarked against the Russell 1000 Growth Index. So, for example, at the end of 2014, EOI had materially more exposure to financials at 16% of the portfolio versus 6% for EOS. And EOS had more exposure to technology at 31% versus 21% for EOI. There are a couple of other notable differences within the sector exposure, too. That said, both ETFs seem to stay fairly close to their benchmarks, shifting their weightings at the edges rather than making big sector bets. (Vastly different from the situation at ETV and ETB.) Notably, however, they also have roughly similar standard deviations over the trailing decade. That’s not overly surprising since both track close to their broadly-diversified indexes, but it means there’s not much of a risk uptick with either one. Performance wise, EOS has slightly outperformed EOI over the trailing 10 years according to Morningstar, turning in an annualized total return based on net asset value through January of roughly 6.8% versus EOI’s annualized return of 6%. Note that Morningstar’s figures include the reinvestment of dividends. On the income score, EOS and EOI both yield around 7.8% based on their market prices, according to the Closed-End Fund Association. Their discounts are also fairly close and in line with their historical averages. Which one? If I had to pick between just these two funds, I’d probably go with Eaton Vance Enhanced Equity Income Fund II, but only because of the slightly better long-term performance. That said, if you are on the hunt for a fund that tracks the S&P 500, EOS is a bad choice because that isn’t what it’s meant to do. For that, EOI is the right option. Neither, however, is a bad fund. In fact, each of their long-term performances compare quite favorably to Morningstar’s Large Growth category. So, in the end, the big difference is the indexes that EOS and EOI follow. That, however, may not mean all that much to you. And if that’s the case, they are close enough cousins that they almost look like twins. Disclosure: The author is long AAPL. (More…) The author wrote this article themselves, and it expresses their own opinions. The author is not receiving compensation for it (other than from Seeking Alpha). The author has no business relationship with any company whose stock is mentioned in this article.