Tag Archives: seeking

Stealing Someone’s Homework

Unit trusts are a simple way to invest, but their fee structures may be cost prohibitive for some. Unit trust companies, in their fact sheets, provide proven selection processes that one is able to replicate. By using their proven track records, one is able to develop a nice portfolio that works well with a “Buy and Watch” philosophy. Equity unit investment trusts are interesting allocation vehicles that have been around since the Investment Company Act 1940. They are investment companies, and the easiest description one can give is they provide a list of researched stocks that one can hold for periods ranging from 15 months to four years. They are unmanaged, as the stocks are selected with the philosophy of holding them throughout the maturity period. When the trust matures, one can take the value of the investment at NAV, or reinvest everything in another portfolio as a “rollover”. Rollovers are usually free. Conceptually, I like them, because they fit well within a “Buy and Hold” strategy, but allow one to make periodic changes over the years. The fee structures, though, make them prohibitive for those who are looking for a way to keep costs down. Fees for First Trust’s Capital Strength Portfolio average an initial 1.975% per year. Invesco’s Dividend Income Leaders Strategy Portfolio has an average annual initial fee of 2.36%. Both of these annual fees are reduced to 1.475% and 1.56% respectively with the free rollovers they provide. There are break points for high net worth investors where the fees can be reduced to 0.725% for First Trust and 0.32% for Invesco. Don’t misread as one saying these strategies do not work. They do. The question is whether one wants to pay the fees. If you don’t, then steal their homework. If one studies the fact sheets these companies provide, they do have fairly easy strategies that can be replicated on one’s own. Take the Capital Strength Portfolio for example. The fact sheet has these parameters for its stock selection process: Begin with the S&P 500 Cash greater than $1 billion Long Term Debt/Market Value of Equity < 30% Return on Equity > 15% Cash Flow Analysis and Analyst Judgment Hold for 24 months Does this strategy work? It sure does. I ran a general backtest to see how this approach performed since 1989. The results? How does an average annual return of 14.46% (σ = 23.82%) work for you? The S&P 500 averaged 10.14% during the same period; an excess of 430 basis points that is nothing to sneeze at. Given that a basic portfolio screen returns around 30 stocks, this is a fairly manageable strategy if one is willing to let the strategy play out over a two year period. The following table provided is a list of potential stocks for a 24 month portfolio: Ticker Name AAPL Apple Inc ACN Accenture PLC ADP Automatic Data Processing Inc. AFL AFLAC Inc AGN Allergan Inc. AVGO Avago Technologies Ltd BEN Franklin Resources Inc BIIB Biogen Idec Inc CA CA Inc CMI Cummins Inc. CTSH Cognizant Technology Solutions Corp EXPD Expeditors International of Washington Inc. FLR Fluor Corp GD General Dynamics Corp GOOG Google Inc GRMN Garmin Ltd INTC Intel Corp JNJ Johnson & Johnson LLY Eli Lilly and Co LRCX Lam Research Corp MA MasterCard Inc MSFT Microsoft Corp NKE Nike Inc PCLN Priceline Group Inc (The) PG Procter & Gamble Co (The) PH Parker-Hannifin Corp QCOM QUALCOMM Inc. SLB Schlumberger Ltd TROW T. Rowe Price Group Inc WDC Western Digital Corp XOM Exxon Mobil Corp YHOO Yahoo Inc Is there another way, though? What if you want to be a completely passive investor, but like this approach to stock selection? Well, there is an option for that too. Using the Capital Strength Index, which has many of the same screening criteria, The First Trust Capital Strength ETF (NASDAQ: FTCS ) is a nice way to go. It is a managed ETF with a moderate fee structure (0.76% gross), and has performed nicely since inception, and still beats the S&P 500. The way I see it, this is a nice passive way to invest, and still get performance from one’s portfolio. The 30 or so stocks are easy to watch and hold, and one only has to restructure biannually. It is an idea one should consider, if indexing is not part of the strategy. It is suggested here to study the strategies, and find one that works for you. If you would rather someone else do the work, then hire the companies and buy one of their portfolios. If that is even too much work, buy the ETF. Happy Investing! Disclosure: The author is long CTSH, QCOM. (More…) The author wrote this article themselves, and it expresses their own opinions. The author is not receiving compensation for it (other than from Seeking Alpha). The author has no business relationship with any company whose stock is mentioned in this article.
Income-Oriented ETF Provides Exposure To Infrastructure Boom

By DailyAlts Staff Investors seeking exposure to global infrastructure assets have a new and attractive option, thanks to the February 11 launch of the Guggenheim High Income Infrastructure ETF (NYSEARCA: GHII ). The new ETF is the first infrastructure ETF to weight its holdings according to 12-month trailing dividend yield, rather than market capitalization or some other measure. The result is an investment vehicle that provides exposure to public services, toll roads, airports, water, pipelines, utilities, and other essential services around the world, with a focus on generating current income for its investors. Global Exposure The Guggenheim High Income Infrastructure ETF tracks the S&P High Income Infrastructure Index, which is composed of the S&P Global BMI’s 50 highest-dividend-paying companies in the energy, transportation, and utilities sectors. The fund and its underlying index have a global footprint, with only about one-fifth of components domiciled in the United States. The fund’s top holdings include investments in Australia (14%), China (9%), Spain (8%), and Italy (8%); and it also has significant exposure to infrastructure assets in Britain, Canada, Singapore, and France. “The infrastructure asset class offers investors the opportunity to realize enhanced return and capital appreciation,” said a Guggenheim spokesperson. “Offering strong cash flow potential, assets with typically long life spans, as well as relatively low volatility and significant barriers to entry, infrastructure provides investors with access to an emerging segment of the market aligned with the global recovery.” Continued Infrastructure Spending The launch of the Guggenheim High Income Infrastructure ETF appears to be well-timed, as governments around the world – despite fiscal and monetary woes – are planning ambitious new rounds of infrastructure spending. Oxford Economics and PwC project global infrastructure spending will total nearly $78 trillion between 2014 and 2025; with about 60% of that attributable to the Asia Pacific. In the U.S., the White House says that infrastructure investment will continue to be needed even after the economy reaches full employment, but that “time is running out to make these needed investments under ideal economic conditions.” Shares of the Guggenheim High Income Infrastructure ETF face an expense ratio of 0.45% – two basis points less than the 0.47% charged by the rival iShares Global Infrastructure ETF (NYSEARCA: IGF ).

Ceasefire In Ukraine And The Oil Price Recovery: A Trend Reversal For The Russian Share Market

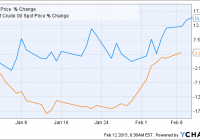
Summary If the cease-fire holds the political situation should start to calm down and the sanctions will be canceled or they will be let to expire. The technical analysis shows that the bottom was reached during December and January and now a major trend reversal should be coming. Most of the Russian companies are significantly undervalued, their P/E ratios should move higher after the political risk eases. The biggest threat is the oil price right now. If it starts to collapse again, the Russian share market rally will be only short-lived. It was reported by the news agencies that the leaders of Russia and Ukraine agreed on a cease-fire that should begin on February 15. It is a really good news for the whole region, assuming that the cease-fire will hold this time. It can represent a significant catalyst for the Russian share market. The Market Vectors Russia ETF (NYSEARCA: RSX ) is 15% higher year-to-date. Most of the gains were achieved during the last two weeks when the oil price started to recover. A prolonged oil price recovery along with a calm down of the political situation may lead to a significant recovery of the undervalued Russian shares. The Russian share market represented by RSX is down by more than 35% over the last 12 months. The main reasons are the oil price collapse, the political tensions between Russia, the western countries and Ukraine and the sanctions against Russia. If the mess around Ukraine is cleaned up, two of the three factors should be at least partially eliminated. From technical point of view it seems like the bottom was reached in the middle of December at $13.36. The share price is 26% higher now. The RSI reached the level of 15 back then but it has recovered very quickly. It is over 58 today and it keeps on growing. Also the moving averages start to signal a major trend reversal when we can expect that the 20-day SMA will surpass the 50-day SMA any day now. The table below shows the estimated P/E ratios of the 10 biggest RSX holdings. The weights are dated January 29, 2015 and the P/E ratios are dated February 12, 2015. As we can see most of the companies have a significant upside potential when we compare their P/E ratios to the P/E ratios of their foreign peers. It is hard to expect that the Russian P/E ratios will match the P/E ratios of the U.S. or European companies due to an increased political risk, but we can expect that the difference will decrease significantly after the political situation around Ukraine calms down. company weight in RSX (29.1.2015) estimated P/E (12/2014) Lukoil ( OTC:LUKFY ) 8.65% 4.6749 Gazprom ( OTCQX:GZPFY ) 7.43% 3.1890 Magnit 6.19% 20.911 Norilsk Nickel ( OTCPK:NILSY ) 6.08% 8.8119 Novatek 5.54% 13.8094 Sberbank ( OTCPK:SBRCY ) 5.32% 4.9904 Tatneft ( OTCPK:OAOFY ) 5.00% 5.4344 VTB Bank 4.96% 34.7950 Mobile TeleSystems (NYSE: MBT ) 4.31% 8.6266 Surgutneftegaz ( OTCPK:SGTPY ) 4.30% 2.1068 Source: own processing using data of Yahoo Finance and Bloomberg Conclusion The bet on the Russian market is still a risky one but the fundamental as well as technical factors start to indicate that it may start to pay off. If both Ukraine and the rebels will observe the cease-fire, the political situation should start to calm down and the sanctions against Russia will be canceled or they will be just let to expire. The technical indicators signalize a major trend reversal as well. The biggest threat is the oil price right now. If the oil price keeps on growing or if it at least doesn’t retest its recent lows, the recovery of the Russian share market should be quite quick. Disclosure: The author has no positions in any stocks mentioned, but may initiate a long position in RSX over the next 72 hours. (More…) The author wrote this article themselves, and it expresses their own opinions. The author is not receiving compensation for it (other than from Seeking Alpha). The author has no business relationship with any company whose stock is mentioned in this article. Are you Bullish or Bearish on ? Bullish Bearish Neutral Results for ( ) Thanks for sharing your thoughts. Submit & View Results Skip to results » Share this article with a colleague