Tag Archives: seeking

REM Compared To Equal Weighted mREIT Portfolios
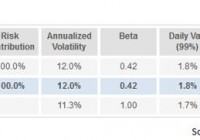
Summary REM holds up better than I would have expected. Market capitalization weighting is easy, but may be less than ideal for reducing risk. REM is compared over a two-year period and a one-year period against hypothetical mREIT portfolios built at equal weights. When I was taking a look at the iShares Mortgage Real Estate Capped ETF (NYSEARCA: REM ), one of my thoughts was that the portfolio would be more attractive with a different weighting scheme. My views on that have changed some since Annaly Capital Management (NYSE: NLY ) reported an excellent second quarter and its new strategy sounds much better . However, I still wondered from a risk-adjusted viewpoint how different an ETF might look if it held the same holdings, but applied an equal weight methodology rather than using market cap weights. The Benefits of Market Capitalization Weighting The biggest advantage to using market capitalization is that it is remarkably easy. The fund establishes the volume of assets and the total market cap of each company. They spend on the shares accordingly, and if they were not trying to grow assets in the ETF (to generate more fees), they would simply leave that same structure in place. The only modifications to be made would be to adjust for the new shares issued and old shares repurchased. In general, this is a very simple kind of ETF to run. The Problem When using market cap weighting, if a company becomes relatively overvalued, it is also likely to have a higher weight in the portfolio. Unless the overvalued status is coinciding with repurchasing shares to shrink the market cap, the weighting will grow. That is unfortunate. It also means a portfolio may have substantially less diversification if some holdings grow large enough to dominate a large chunk of the portfolio. Equal Weighting My theory was that even though smaller companies will on average be more volatile (as demonstrated in the charts I will provide), the benefit of better diversification could cancel out those effects. Equal weighting is rarely going to be the ideal method, but it provides a simple alternative to market capitalization. Findings I originally built a spreadsheet to run an analysis of correlations and simulate different portfolios, but I find the tools at InvestSpy.com were faster than running it through my spreadsheets. Therefore, I simulated the portfolios using its website. REM has a total of 39 holdings, but I ran my first comparison using only 20 mREITs. The names included several of the largest from the REM portfolio and some that I cover that are not given material weights in the portfolio. The analysis was based on comparing the last 2 years of returns. REM 2 Years (click to enlarge) The primary factor that I’m looking at here is that the annualized volatility of the portfolio is 12% and the beta is .42. I’m focused on testing for risk rather than testing for historical returns since using historical returns would create an enormous bias into the test, as I could simply avoid selecting mREITs that have cratered when designing my comparable 20 mREIT portfolio. Equal Weighted 20 The next table is going to be dramatically larger because it is showing the numbers for each individual mREIT. (click to enlarge) This portfolio made of 20 mREITs with equal weights shows a lower annualized volatility at 11.2%; however, it also shows a beta that is slightly higher at .43. I would say that given the sample size (only 2 years), the beta comparison is within the margin of error. Some other factors jump out when we look at this as well. The stock that generated the highest risk contribution was CYS Investments (NYSE: CYS ). It was not the highest volatility, it was not the highest beta, and yet it contributed the most to the portfolio. It also had one of the best return percentages. On the other hand, Blackstone Mortgage Trust (NYSE: BXMT ) delivered in every way. The risk contribution was low and the annualized volatility was the lowest within the group. Despite that, it had a total return of 31.2%, which should remind readers that not all risk and return tradeoffs are created equally. Both the highest-risk contributor and the lowest-risk contributor were near the top of the chart in their total return over the last 2 years. One-Year Comparisons The following chart has REM’s performance over the last year: (click to enlarge) For comparison, this time I wanted to replicate a larger portfolio, so I am only excluding one security from the portfolio. That security has a very short history and thus is not viable for the statistics. It should be noted that I have cropped the following image to make it substantially shorter since the site struggles with displaying longer charts. (click to enlarge) In this second comparison, there are about 37 mREITs all under equal weighting, but the annualized volatility for the portfolio is within a margin of error. In the context of a year, .1% is not reliable. Interesting Notes When I shifted to using 37 mREITs for the one-year measure, I was expecting it to result in a larger reduction in volatility, but it did not. It would seem the volatility of those smaller mREITs was enough to outweigh the benefits of more diversification. Investing in ETFs is generally relying on diversification within moderately efficient markets to be worth the costs. For the mREIT investor that has the best information, I don’t think the diversification is adding any advantages. However, for the mREIT investor who just wants to set it and forget it, the REM portfolio has done remarkably well. Comparison of Holdings The following chart shows the top 10 holdings of REM: (click to enlarge) As you can see Annaly Capital Management and American Capital Agency Corp. (NASDAQ: AGNC ) dominate the portfolio and combine to be over 26% of the portfolio value. Conclusion The way REM designs the portfolio is not perfect in my opinion; however, it is still done well enough to offer investors some fairly substantial reduction in risk. The expense ratio is high for my tastes at .48%, but at least investors are receiving a fairly substantial reduction in volatility, and when compared to other weighting methods, such as going equal weight, REM has done fairly well. If you are curious about the risk factors for REM, you’ll want to see my last piece on the ETF . Next time I cover REM I’m going to establish comparisons to the portfolio I would create if I were aiming to produce an ETF full of mREITs. Scroll up to the top of the article and hit the follow button so you don’t miss it. Disclosure: I/we have no positions in any stocks mentioned, and no plans to initiate any positions within the next 72 hours. (More…) I wrote this article myself, and it expresses my own opinions. I am not receiving compensation for it (other than from Seeking Alpha). I have no business relationship with any company whose stock is mentioned in this article. Additional disclosure: Information in this article represents the opinion of the analyst. All statements are represented as opinions, rather than facts, and should not be construed as advice to buy or sell a security. Ratings of “outperform” and “underperform” reflect the analyst’s estimation of a divergence between the market value for a security and the price that would be appropriate given the potential for risks and returns relative to other securities. The analyst does not know your particular objectives for returns or constraints upon investing. All investors are encouraged to do their own research before making any investment decision. Information is regularly obtained from Yahoo Finance, Google Finance, and SEC Database. If Yahoo, Google, or the SEC database contained faulty or old information it could be incorporated into my analysis.

VCR: An ETF For Both Traders And Long-Term Investors

Summary The sector specific exposure makes the ETF a reasonable pick for investors who expect the sector to outperform. The low expense ratio makes it a viable long-term holding for the buy and hold investor. The biggest weakness for a buy and hold strategy here is that the dividend yield would be insufficient to provide retirement income without an enormous portfolio. Investors should be seeking to improve their risk adjusted returns. I’m a big fan of using ETFs to achieve risk-adjusted returns relative to the portfolios that a normal investor can generate for themselves after trading costs. I’m working on building a new portfolio and I’m going to be analyzing several of the ETFs that I am considering for my personal portfolio. A substantial portion of my analysis will use modern portfolio theory, so my goal is to find ways to minimize costs while achieving diversification to reduce my risk level. In this article, I’m reviewing the Vanguard Consumer Discretionary ETF (NYSEARCA: VCR ). Does VCR provide diversification benefits to a portfolio? Each investor may hold a different portfolio, but I use the SPDR S&P 500 Trust ETF (NYSEARCA: SPY ) as the basis for my analysis. I believe SPY, or another large cap U.S. fund with similar properties, represents the reasonable first step for many investors designing an ETF portfolio. The correlation is about 88%, which is low enough that I’m expecting some diversification benefits, but I would not expect it to be dramatic. Standard Deviation The standard deviation of annualized returns for VCR was 12.8% compared to SPY at 12.1%. So VCR is slightly more volatile but using it as a small part of a portfolio would get past even that problem. For instance, using VCR at 10% would have brought the annualized volatility down to 12.0%. Yield and Taxes The distribution yield is 1.11%. Simply put, the ETF doesn’t make much sense for retiring investors who want to use portfolio yields as a large part of their retirement income. Sure, they could sell shares to generate income, but that may create a temptation to change the portfolio strategy at the wrong time. Expense Ratio The ETF is posting 0.12% for an expense ratio. That is not bad compared to other ETFs, though it is slightly higher than SPY at 0.09% and higher than a few of the other more popular Vanguard ETFs. Market to NAV The ETF is trading at a 0.02% premium to NAV currently. I don’t see that as being a big enough issue to matter. A few very small ETFs may see their values deviating from NAV but this Vanguard fund should be staying very close to NAV. Largest Holdings The diversification within the ETF would be weak compared to a whole market ETF, but given that this is a specific sector allocation for consumer discretionary stocks, the diversification is better than many investors might expect. (click to enlarge) Through diversification it may be possible (just barely) to lower portfolio risk by adding the ETF due to the correlation. However, the most logical argument for adding the ETF to the portfolio is an investor believing that this sector is set to outperform based on analysis of macroeconomic factors. A belief that the sector is likely to do well would be a great rationale for holding the ETF; however, it would imply more of a short to intermediate term trading mentality rather than a long-term core holding. Does That Make it Bad for Retail Investors? I would not go that far. The volatility is reasonable and the expense ratio is low. So long as the expected returns are keeping up with the market, there is no reason to say the portfolio is unsuitable for a long-term buy and hold investor. I think it makes an ideal fit for a trader who is moving their assets based on macroeconomic analysis, but it is still a reasonable option for the buy and hold investor as well. The thing those investors should remember is to take advantage of the benefits of lower correlation by rebalancing their portfolio. If it is tax exempt, that could be accomplished easily by buying and selling. If the portfolio is not tax exempt, it may be better to adjust exposure by simply adding cash and buying the fund that has fallen below the ideal weighting. Conclusion This is a solid all-round ETF for any investor who wants to add an emphasis on the “consumer discretionary” sector to their asset allocations. As a sector ETF, it would work well for traders, but the low expense ratio and reasonable level of volatility make it a fine choice for the long-term buy and hold investor as well. The one concern for the buy and hold investor may be the weak dividend yields which would be insufficient for retirement income. Disclosure: I/we have no positions in any stocks mentioned, and no plans to initiate any positions within the next 72 hours. (More…) I wrote this article myself, and it expresses my own opinions. I am not receiving compensation for it (other than from Seeking Alpha). I have no business relationship with any company whose stock is mentioned in this article. Additional disclosure: Information in this article represents the opinion of the analyst. All statements are represented as opinions, rather than facts, and should not be construed as advice to buy or sell a security. Ratings of “outperform” and “underperform” reflect the analyst’s estimation of a divergence between the market value for a security and the price that would be appropriate given the potential for risks and returns relative to other securities. The analyst does not know your particular objectives for returns or constraints upon investing. All investors are encouraged to do their own research before making any investment decision. Information is regularly obtained from Yahoo Finance, Google Finance, and SEC Database. If Yahoo, Google, or the SEC database contained faulty or old information it could be incorporated into my analysis.

Monday Morning Memo: ESG Criteria As A Tool For Stock Selection

By Detlef Glow Stock selection is one of the most critical aspects for equity fund managers, since that is the point where they are supposed to deliver so-called alpha as value added from active management and therefore the justification for their management fee. I have had a number of meetings with portfolio managers over the past 20 years, and most of them told me they try to find high-quality stocks. That said, one can imagine the quality of a stock is defined differently by each manager. Asked how they evaluate quality, most managers told me they have implied quantitative screens for financial data, and they meet with the management of companies to verify future expectations of the companies’ operation. But few of the fund managers told me they use environmental, social, or governance (ESG) criteria for stock selection. Nevertheless, nowadays a number of portfolio managers employ at least one ESG criterion in their screening process. This shows that the integration of ESG criteria has gained ground in the conventional asset management industry. From my point of view it is not surprising that even conventional fund managers have started to use ESG criteria, since these data deliver a unique view of a company that is not dependent on financial data. Fund managers who employ ESG data and criteria in their selection process have an opportunity to gain a competitive edge through the use of information that is not used by their competitors. But, what information can be gathered from ESG criteria? Using ESG criteria the research process should lead to companies that have good policies on environmental and social aspects and a strong management that follows best-practice guidelines and has no conflicts of interest. In more detail ESG data can be used to identify so-called corporate-specific risks, i.e., the risk of fatalities, outages, fraud, or strikes as well as macro risks such as labor intensity or a shortage of skills, weather impacts, data protection, security issues, or possible water shortages. From my perspective the lack of education is a key factor of why ESG criteria will not be used widely in the asset management industry in the short term. But, with the turnover in staff and the educational efforts by industry associations and promoters of advanced education courses, the use of ESG criteria will become more popular over time. There is evidence that investors from Generations X and Y are more demanding with regard to information about how their money is invested. In addition, surveys have shown that investors from these generations are also more tuned to a lifestyle of health and sustainability and want to invest their money in funds that have similar goals in place. This means the demand from investors for products using a sustainable investment approach should increase, since Generations X and Y have just started to become investors. From my point of view this demand will be the main driver for a change in thinking and acting within the wider asset-management industry. Early adaptors might be the winners in this trend, since they can build up a reputation as thought leaders, along with a performance track record, prior to their competitors. The views expressed are the views of the author, not necessarily those of Thomson Reuters.