Tag Archives: seeking-alpha

Is The End Beginning For The Euro Dream?

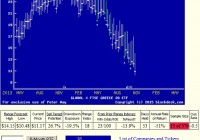
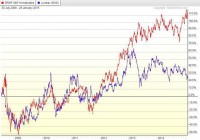
Summary Electing a “popular” populist government, the economically suffering population of Greece has brought the country’s future and involvement with the ECM to a showdown. This first, possibly of several, such confrontations makes clear that a common currency, the Euro, is only going to work where participants accept common rules of economic behavior. The ECB has told Greece the rules of the game, and Greece refuses to give up its National Sovereignty. The ECM’s February 28 deadline for Greece’s conformity is DOA. Greek PM Tspiras and ECM leaders (Germany’s Merkel) now are locked in the “chicken” game of who takes the blame (and loss) for a Greek national debt default. The Euro? or the (reverted-to) Drachma? US market-makers for the Greek ETF and the Euro ETF see no winners. A forecast for crumbling co-ordination of Europe’s economies? Greece: The Fat’s in the Fire; who takes the “fall”? Greece apparently has lived for years without the internal economic disciplines necessary to maintain a sound currency. Hiding behind a smokescreen of the “Euro” currency has finally pushed the European Common Market leaders’ patience to a point of resolution. Now it is apparent that for the ECM to actually work, bringing together several national interests in the expanding rivalry for world trade competition, its members have to either have productive internal disciplines, or become wards of those states that do. Many notable European countries made this assessment early in the ECM’s formation, and said “thanks, but no thanks” to the proposition of carrying the undisciplined nations via a common currency and common debts related to it. Not all Common-Market members are committed to acceptance and support of the Eurodollar. Not so strangely, those several nations unwilling to play the Euro-currency game were nations quite able to compete and support themselves without the encumbrance of being enablers to the undisciplined. We are amateur observers of international politics, incompetent to suggest how the Greece vs. ECM tussle will eventuate. But we do have the ability to track how the expectations of far-better-informed observers are trending. Ones who are willing to put some wallet-skin in the game, more than just mouth-skin. They are the market-makers [MMs] who help big-money-fund world investors shift the emphasis of their portfolios in search of capital-growth opportunities. Because the investment amounts are large they often stretch the capacity of established markets at times and prices to which other portfolio managers [PMs] are willing to commit. The MMs will commit temporary capital investments from their own funds to make up the differences if the risks involved can be adequately protected by hedging actions. What that price-change protection will cost gets included in the transaction price of the whole block trade being attempted. If it is too large for the PM issuing the trade order, the transaction is killed. When the cost is acceptable, the trade order is filled at a single price per share in its entirety. What the cost will be depends upon the buyer and seller of the protection coming to agreement upon just how much the trade order issue may change in price during the life of the hedge. These days the MMs are typically publicly-owned “investment banks” with extensive borrowing capacities well beyond the reach of 20th century exchange specialists and private hedging and arbitrage firms. Today’s MMs have for decades maintained world-wide information-gathering systems staffed 24x7x365 with reporters and researchers whose principal assignment is to keep the block trade desks (insurance buyers) and proprietary trade desks (insurance sellers) at least as well informed as the fund clients, and better, if possible. The MM firms bring to the transaction party skills and resources in information technology, arbitrage, and hedging that often are beyond those of their clients. What is paid for the price change insurance, and accepted by fund PMs tells just how far those concerned believe the issue’s prices might move. Because the insurance includes equally well-informed buyers and sellers, the resulting expectations are often not simply symmetrical expressions of uncertainty. The balance between upside and downside price change prospects can be a useful guide to coming actual price changes. In addition, the trends in how those price change ranges are moving brings further insights to each proposition. So what’s the current Greek and Euro picture? Not surprising, here is the past two years’ track of expectations for the Global X FTSE Greece 20 ETF (NYSEARCA: GREK ). The heavy-dot market price separates each once-a-week vertical line price range forecast into upside and downside price change prospects. (used with permission) Which looks a lot like the way prospects for the Euro are being reflected in the Currency Shares Euro ETF (NYSEARCA: FXE ). A similar trend of expectations, with more noise, appears in the Vanguard FTSE Europe ETF (NYSEARCA: VGK ), which tracks the index of stocks in Developed Countries of Europe. My first professional employ in the investment business after graduate school was at an eponymously-named NYC investment counsel firm led by a renowned economist. He once remarked “Only in America do they teach Economics, everywhere else they teach Political Economics.” At present there are political economic actions being undertaken by the ECB that have short to intermediate-term stimulating impact for Europe. The dream of a competitively-united “common market” provides the focus for such actions, through the ECB – at least at this point in time. But the potential for the dream’s accomplishment is getting a wake-up call from Greece where national identity and determination is being presented as a lever to achieve even further escape from real-world disciplines. Now other Common Market nations (as differentiated from “Eurodollar” nations) are further forced to anticipate becoming one of two coming alignments: Greece gets away with making the rest of the ECM be its present “sugar-daddy” and becomes the model for other like-minded states, for the rest of the Community to support (in perpetuity?), or The ECM forces Greece to accept its original terms, leading to a clear recognition of the National Sovereignty issues involved by all members, with potential voluntary departures of members essential to the ECM’s continuity. Conclusion This may be the inverse of a win-win situation. At present the professional investment community seems to think that’s possible, given their read of VGK. It is another example of ETFs being a part of the economic outlook. Disclosure: The author has no positions in any stocks mentioned, and no plans to initiate any positions within the next 72 hours. (More…) The author wrote this article themselves, and it expresses their own opinions. The author is not receiving compensation for it (other than from Seeking Alpha). The author has no business relationship with any company whose stock is mentioned in this article.

Lumber Is The Canary In The Homebuilders’ Coal Mine

Summary Lumber prices have historically tracked quite well with homebuilder stocks. Homebuilders have also recently surged past the S&P in recent months. With the deceleration in price gains still going on and Fed support quickly evaporating, there is nothing left to prop up this industry. While I have been generally skeptical of the supposed recovery in homebuilder stocks, I have limited my analysis to trends in home prices and the ability of the American consumer to handle a mortgage at current prices. For me, this analysis is sufficient to show that homebuilder stocks are in a pretty large bubble. In the following article, though, I plan to show the value of homebuilder stocks relative to lumber prices, which themselves are a good economic indicator, but also tend to follow the valuation of homebuilder stock. The Tight Relationship of Lumber and Homebuilders (click to enlarge) In the preceding chart, I have plotted the SPDR S&P Homebuilders ETF (NYSEARCA: XHB ) and spot lumber prices. A clear correlation emerges from before 2009 to around 2013. What we also see is that around 2013, while lumber prices crashed, homebuilder stocks continued onward, and more recently have even seen some gains. Generally lumber prices are thought to track the economy quite well. While many economic analysts have been bullish on the future of the US economy, commodity and bond markets have been showing for more than a year now signs of languish. A plot of corporate bond prices would show much the same thing as lumber prices in this graph, as they also have stalled starting around the beginning of 2014. More interestingly, other commodities have started to follow along in this weakening trend, with oil recently showing a spectacular fall and copper following along. Commodity markets are showing signs of warning about the future of the economy. Lumber especially has shown a historical tight relationship with the value of homebuilder stocks, and given what has happened over the past two years, we ought to be worried about the future prospects for share prices. The next plot that I have shown is the past 6 months of the relationship between lumber and XHB. (click to enlarge) What we see from this chart of the relative valuation of XHB to lumber prices is that they have traded in a relatively tight range. Starting in 2015, however, we notice a sharp spike upwards that was quickly corrected. Over the past few days this relative valuation has shot up again. Given the last swift correction in this ratio, we can probably expect homebuilders to go down in the near-term. The homebuilder rally seems to be losing steam, as the market reacted violently to this push above historical highs. Future Prospects for Timber (click to enlarge) In order to predict future movements in the price of wood, shown above is a graph of the iShares S&P Global Timber & Forestry Index Fund (NASDAQ: WOOD ). Chaikin Money Flow analysis shows strong price growth ending around the middle of September, interrupted by a strong selloff in October, corresponding quite nicely with the overall stock market. Interesting is that since then there was a brief rise in money flow, but even while this has slowed noticeably, the price appreciation has still continued. This seems like price gain without much support, and so even timber prices themselves may be unsustainable in the medium term. What is more worrying for timber prices is the state of the overall economy. Consistently low oil will likely result in slowed economic activity as oil exploration companies drastically reduce capex spending. With decreased capital spending, we can assume downward pressure on GDP growth, which is an ominous sign for timber, as well as for housing. Technical Analysis of XHB (click to enlarge) Technical analysis of XHB itself shows signs of weakness. At the end of November XHB reached a value of about 33.50, at which point momentum was lost and the stock began to fall. While XHB has been higher since then, it also has not been able to make any real progress. Volatility in XHB has drastically increased since that time, and perhaps a greater source of worry is the Chaikin Money Flow, which turned definitely negative throughout December and has not been solidly positive since then. The market seems to find the current valuation as high enough. Summary and Action to Take XHB has seen to lost momentum, as it has not been able to have a solid increase in value since the end of November. In addition, the trend of homebuilders with XHB is approaching historic highs, and this has been met with swift correction in XHB. The long term trend shows definite signs of worry, as lumber has not agreed with the high current valuation of XHB. Now would be a great time to sell any shares of XHB, as the stock is not likely to go any higher from here on. For a more speculative investment, shorting XHB would likely be a good idea. A long time horizon is probably needed for that trade to play out, though, as XHB has been able to keep this high relative valuation for more than a year now, and only time will tell how long it will be able to keep this up. In addition, if you want to play on the underlying weakness of the US economy, shorting the WOOD ETF may be the way to go. If GDP is unable to sustain itself, then timber prices will go down along with it. This is a very speculative move, however, since timber itself does not show signs of being overbought like the homebuilders. Still, timber is going to hurt if the economy slows. I still take shorting homebuilders as the safer option since not only will they fall if the economy stumbles, but they are also presently overvalued and due for a correction even if GDP does not change much. Disclosure: The author is short XHB. (More…) The author wrote this article themselves, and it expresses their own opinions. The author is not receiving compensation for it (other than from Seeking Alpha). The author has no business relationship with any company whose stock is mentioned in this article.

Updating The Baker’s Dozen Portfolio: A Slight Modification Of The IVY 10

Constructing a portfolio with as few as 13 ETFs. Reduce risk by introducing a “circuit breaker” ETF. Finding low correlated ETFs. A slight modification to the IVY 10 Portfolio. The Baker’s Dozen Portfolio was first presented approximately three months ago. This is an update of that momentum model which is a slight modification of the IVY 10 Portfolio. While the Baker’s Dozen includes 12 ETFs plus SHY , the cutoff ETF, it could easily be paired down to 10 as VOE and VBR are highly correlated with VTI . As with the IVY 10 Portfolio, it does not take many ETFs to provide global diversification. In this portfolio VEA is selected as the Developed International Equity instead of VEU since VEU also contains emerging market stocks. The asset class, Emerging Markets is covered by using VWO . This removes a little duplication that shows up in the IVY Portfolio. PCY is part of the Baker’s Dozen in an effort to spread the risk from domestic to international securities. Gold (NYSEARCA: GLD ) is included in the Baker’s. Otherwise the holdings compared to the IVY 10 are similar. The following thirteen ETFs were selected for their diversity and low correlations. Vanguard Total Stock Market ETF VTI – This ETF covers the entire U.S. Equities market and therefore should be part of any portfolio that uses ETFs for core investments. Vanguard Mid-Cap Value ETF VOE – As a mid-cap value ETF, this security is highly correlated with VTI, but is included to provide a value tilt to the portfolio as recommended in the Fama-French five factor model (FF-5). Vanguard Small-Cap Value ETF VBR – In keeping with the FF-5, this ETF is added even though it too is highly correlated with VTI. If one were to simplify this portfolio, VOE and VBR are the two ETFs to eliminate from the Baker’s Dozen. Vanguard FTSE Developed Markets ETF VEA – For our developed international equities ETF we select VEA. Vanguard FTSE Emerging Markets ETF VWO – VWO is our emerging market ETF of choice. If one wishes to further simplify the portfolio it is possible to merge VEA and VWO and use only VEU as that ETF includes emerging market stocks. Vanguard REIT ETF (NYSEARCA: VNQ ) – Domestic Real Estate is included as an inflation hedge and it provides a good source of income. SPDR Dow Jones International RelEst ETF (NYSEARCA: RWX ) – International Real Estate provides an additional hedge to inflation and it adds another asset class with good income. PowerShares Emerging Markets Sov Dbt ETF PCY – Emerging markets sovereign debt is a different type of security and is added for both diversification and high yield. PowerShares DB Commodity Tracking ETF (NYSEARCA: DBC ) – Commodities is another asset class and serves as a low correlation asset when compared with VTI. SPDR Gold Shares GLD – Precious metals is yet another asset class that has a low correlation with our equity holdings such as VTI, VOE, and VBR. iShares 20+ Year Treasury Bond (NYSEARCA: TLT ) – This 20+ Treasury instrument provides backing from the U.S. Government and adds additional diversity to the portfolio. iShares TIPS Bond (NYSEARCA: TIP ) – TIPs are included as another inflation hedge. This ETF also has a low correlation with equity securities. iShares 1-3 Year Treasury Bond SHY – This Treasury ETF is our cutoff or “circuit breaker” security as this management model seeks ETFs that are performing above SHY and sells ETFs that are under-performing SHY. These ETFs were selected for low correlations as shown in the cluster diagram below. As mentioned above, VOE and VBR are highly correlated with VTI and are the first places to simplify this portfolio. ETF Rankings: The following ranking table contains many risk reducing clues. The primary one is to stay away from ETFs that are ranked below SHY. Currently, that includes Commodities and Gold . A secondary risk reducer is to sell the security when it is price below its 195-Day Exponential Moving Average. VEA and DBC would be sold on that basis. Back-testing indicates better returns are obtained when one concentrates the portfolio in a few ETFs rather than spreading out investments over a larger number of holdings, even if they are performing above SHY. For a number of weeks, VNQ and TLT have been the stars of the Baker’s Dozen. (click to enlarge) Performance Graph: The following performance graph is a recent example of how a portfolio made up of just a few well-diversified ETFs performed since early October of 2014. This graph is from the Rutherford Portfolio and readers can click on the link to learn more about the management of this portfolio. Portfolios are reviewed every 33 days and in the case of the Rutherford, rebalancing moved equal percentages of the portfolio into the top two holdings. If this were to be rebalanced today, we would hold 700 shares in VNQ and 450 shares in TLT in this $125,000 portfolio. These figures are rounded. (click to enlarge) Disclaimer: The above graph will not likely continue this wide divergence from the VTTVX benchmark. 1) The time period is very short for this “live” portfolio. 2) I do not expect TLT to continue its excellent performance. Over the last month there were days when TLT was running in the opposite direction of the market and this aided the overall performance of the Rutherford. It is expected that these momentum managed portfolios will outperform the market when the next severe bear market strikes. That will be the real test of this risk reducing model. Disclosure: The author is long VNQ, TLT, VTI, RWX. (More…) The author wrote this article themselves, and it expresses their own opinions. The author is not receiving compensation for it (other than from Seeking Alpha). The author has no business relationship with any company whose stock is mentioned in this article.