Tag Archives: seeking-alpha

Building The Core With Vanguard: Domestic Bonds

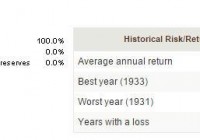
Summary Every ETF investor needs to consider what holdings will form the very core of their portfolio. For the portion relating to domestic bonds, Vanguard’s Total Bond Market ETF is a compelling choice. Also discussed are reasons every investor should consider holding bonds in their portfolio, despite what is often described as a negative current environment. For my first articles for Seeking Alpha, I decided to start simple: tackling the question of building a solid core portfolio using ETFs offered by Vanguard Funds. I started with domestic stocks featuring the Vanguard Total Stock Market ETF (NYSEARCA: VTI ). For this second article, I turn to domestic bonds, and will be featuring the Vanguard Total Bond Market ETF (NYSEARCA: BND ). Bonds? Now? Really…? This might seem an odd time to be featuring bonds. After all, interest rates are at, or close to, historical lows, and common wisdom says they are sure to rise from here. Couldn’t our time be better spent considering other options? I might best answer that question by sharing a personal observation of mine. I tend to have CNBC.com up most of the time as one of the tabs in my browser. Last July (2014), this article titled “Why a $60B fund manager is sitting on 20 percent cash,” featuring BlackRock portfolio manager Dennis Stattman, caught my eye. To explain why he was sitting on 20% cash, the article starts with this attention-grabbing quote from the fund manager: “We don’t like the bond market.” The article goes on to enumerate all of his reasons for that view. But once you got past all that, here was the part that caught my eye. His allocations were 58% in stocks, 23% in bonds , and 19% in cash. My takeaway: Regardless of his stated feelings concerning bonds, that fund manager still had some portion of his portfolio in that asset class. Here is a second point of reference to consider. This resource from Vanguard features historical returns going all the way back to 1926 for various model portfolios, in 10% intervals – ranging all the way from 100% stocks and 0% bonds to the other extreme, 0% stocks and 100% bonds. I selected two of these to look at quickly. The first, a portfolio with 100% stocks, and the second with 60% stocks and 40% bonds: I won’t belabor the points, but a couple of things jump out. On the one hand, the allocation with 40% bonds has an average annual return of 1.4% less than one with 100% stocks. On the other hand, the worst single-year loss is 26.6% as opposed to 43.1%. Depending on a vast array of variables – including the possibility of having to sell at precisely the wrong time due to personal financial circumstances – that could make a big difference. You also derive consistent income from bonds (although, admittedly, not so much at present). This can provide you with funds to reinvest in whatever asset class you wish. Putting it all together, that BlackRock investment manager, at some level, had virtually a 60/40 stock versus bond allocation, but he chose to hold 19% in cash because he “[didn’t] like the bond market.” On a personal note, at the time that this article caught my eye, my personal bond allocation was higher than his, and I actually made an adjustment to bring it more in line with what he was doing. In summary, while you may make various decisions as to their weighting , if you believe in a disciplined portfolio as opposed to market timing, bonds deserve a place. And That Brings Us To BND (Composition) What makes BND such a good ETF to serve as the core for this portion of your portfolio? I believe it boils down to two factors: Outstanding diversification Reasonable duration BND tracks the Barclays U.S. Aggregate Float Adjusted Bond Index . This includes a wide range of government, corporate, and even international dollar-denominated bonds. All are investment-grade (Moody’s rating Baa and above), meaning you are not getting into “junk bond” territory in this particular ETF. I will have more on the risk characteristics below. The fund does not actually own every constituent in the index, but rather samples the index, holding a basket of securities that approximate the full index. The latest datasheet reveals 9,330 bonds in the actual index and 7,364 in the fund itself. As featured in this introductory article , bonds have two main risks: interest rate risk and default risk. Fortunately, the information that you need to evaluate this is provided on the datasheet for any bond ETF you are likely to consider. Here is that information directly from the latest datasheet for BND: (click to enlarge) Interest Rate Risk Let’s start with interest rate risk. When it comes to a bond mutual fund or ETF, the key data point that you need to identify is the fund’s duration . Once you identity this, the general rule is simply to multiply the fund’s duration by the change in rates . In other words, if a fund has a duration of 2 years and there is a 1% upwards move in interest rates, the value of the fund is likely to decrease by 2%. This is intended to be a general guideline as opposed to a precise number, because interest rates may rise or fall by different amounts across various terms. As an example, BND holds bonds with maturities basically ranging from 1 year to 30 years. Still, this serves as a reasonable measure of the amount of risk that you are assuming. With that in mind, note the average duration of 5.6 years displayed on the datasheet for BND. Given that, a 1% increase in interest rates could lead to a temporary loss of 5.6% of principal. I say “temporary” because unless you need to sell, this is only on paper. Remember, bonds have a face value , and this is the amount the bond is ultimately worth on the date of maturity . Also, when evaluating this, perhaps against just leaving your money in cash, consider the current SEC yield (as of 6/9/15) of 2.06%. Default Risk The second main risk with bonds is default risk. This refers to the possibility that the issuer could experience financial difficulties such that they are unable to meet the obligation to pay the face value, to return the original capital invested. Fortunately, ratings agencies rate the creditworthiness of bonds on a descending scale. Even more fortunately, default data is available for each rating category, due to the Municipal Bond Fairness Act of 2008. With that in mind, here is my analysis of this risk for BND: Essentially, I started with the weightings by Moody’s rating as published on the BND datasheet. I then multiplied this by the default risk as identified in the above-linked report, to arrive at a weighted default risk. For BND, my calculation reveals a default risk of .86%. The counterpoint to that, of course, is that lower-rated bond issuers have to offer a higher coupon or interest rate to attract buyers for their bonds. So, funds have to pick a balance of risk/reward. In other words, how far down the scale of default risk are they willing to go in search of higher returns? In the case of BND, the lowest rating currently accepted in the ETF is Baa , which is defined by Moody’s as: “… judged to be medium-grade and subject to moderate credit risk and as such may possess certain speculative characteristics.” You may also note that, cumulatively, 86.2% of the fund’s securities are rated A or higher, with 63.4% in government securities, which are generally considered to be virtually free from default risk. In summary, BND is a solid core holding because of its moderate duration (5.6 years) and credit (or default) risk, due to all holdings being rated Baa and above. Costs and Expenses Similar to that of VTI, BND carries one of the lowest expense ratios in the ETF marketplace, at .07%. To that, of course, you have to add your trading commissions. Vanguard offers its own ETFs commission-free, and TD Ameritrade offers a decent selection of commission-free Vanguard ETFs. Suitability As a core holding, BND is suitable for all portfolios. Alternatives Other ETFs worth considering, particularly if your broker offers them commission-free, are the Schwab U.S. Aggregate Bond ETF (NYSEARCA: SCHZ ) and the iShares Core U.S. Aggregate Bond ETF (NYSEARCA: AGG ). SCHZ features an industry-low .05% expense ratio, and AGG comes in at .08%. However, even if your broker offers commission-free trading on one of these alternatives, I might still hold BND as a core position and use one of the commission-free options to make small incremental purchases, such as monthly or quarterly investments, adjust portfolio weighting and the like. As a Fidelity client, this is how I use BND and AGG (commission-free trading) in my own portfolio. Last-Minute Personal Comments As I complete this article, the interest rate environment continues to be volatile. If you are considering an initial investment in bonds at this point, I might offer two suggestions: Consider establishing your initial position in multiple increments – perhaps 25% at a time. In so doing, if interest rates rise and prices drop, you will gain some proportionate benefit. Of course, this means a commission on each transaction (for most of us), but the benefits may offset this. Consider using another Vanguard ETF, the Vanguard Short-Term Bond ETF (NYSEARCA: BSV ), for some portion of your position. This ETF has a duration of only 2.7 years and a current SEC yield of 1.08%. The trade-off, as you can clearly see, is a little less income in return for less downside risk. Disclosure: The author is long AGG, BND, BSV, VTI. (More…) The author wrote this article themselves, and it expresses their own opinions. The author is not receiving compensation for it (other than from Seeking Alpha). The author has no business relationship with any company whose stock is mentioned in this article. Additional disclosure: I am not a registered investment advisor or broker/dealer. Readers are advised that the material contained herein should be used solely for informational purposes, and to consult with their personal tax or financial advisors as to its applicability to their circumstances. Investing involves risk, including the loss of principal.

Clean Energy Fuels – 2 Reasons And 4 Charts Show Why It’s A ‘Buy On The Dip’ Opportunity

Summary CLNE will benefit from the increasing usage of natural gas in electricity generation in the long run as this will push up the price of the commodity. Though natural gas trucks cost $50,000 more than diesel trucks, they can deliver annual fuel savings of around $25,000, creating a tailwind for CLNE as this will increase NGV adoption. The drop in diesel prices hasn’t discouraged fleet operators from buying more natural gas trucks, and this will allow CLNE to maintain its volumes even in adverse circumstances. CLNE is gradually building up fueling infrastructure that will help it increase its addressable market and land more customers for fueling services in the long run. Clean Energy Fuels (NASDAQ: CLNE ) has appreciated over 50% in 2015, but the stock has lost momentum ever since it posted weak Q1 results around a month ago. In the past one month, Clean Energy shares have dropped over 13% since the company missed consensus estimates owing to slower adoption of natural gas vehicles and the decline in natural gas prices. As a result, despite an increase in volumes of natural gas delivered, Clean Energy’s financial performance contracted and its revenue was affected to the tune of $3.7 million due to weak natural gas pricing. But, in my opinion, the drop in Clean Energy’s stock price over the past one month has given investors an opportunity to buy the stock on the dip. If we look at the long run, Clean Energy will benefit from two key factors — an increase in natural gas prices and the increasing adoption of natural gas fleets. In this article, we will take a closer look at these points and see why Clean Energy is a good buy-on-the-dip opportunity. Natural gas prices have started recovering Natural gas prices have recovered slightly since the end of April as shown in the chart below: Henry Hub Natural Gas Spot Price data by YCharts The recent recovery in natural gas prices is being driven by the injection season, as demand for the fuel has increased due to low pricing and the hot weather. In fact, the latest injection season has seen strong refill activity that has exceeded the five-year average injections by a comfortable margin, according to the EIA. Additionally, the hot summer season has led to an increase in the usage of air conditioners, which has again pushed up demand for natural gas. Now, it should be noted that natural gas is increasingly replacing coal as a source of electricity generation as shown below: The basic point that I am trying to put across over here is that demand for natural gas is increasing, and this will help decrease the oversupply in the U.S. natural gas market. In fact, over the long run, usage of natural gas in electric generation will continue increasing at a steady pace as more power plants switch from coal to gas. This is because the conversion rate of natural gas into electricity stands at 90% as compared to only 30% in case of conventional fuels. Thus, as the demand-supply situation in the natural gas market improves, prices will get better. This will act as a tailwind for Clean Energy as the company suffered last quarter due to a drop in prices. In fact, over the long run the EIA expects natural gas prices to recover strongly as pointed out in its latest Annual Energy Outlook as shown below: (click to enlarge) Source Thus, investors should not worry much regarding the short-term concern around natural gas prices as the future of the commodity looks robust in the long run. Corporations are switching to natural gas vehicles despite the decline in oil prices The massive decline in oil prices over the past year has made diesel cheaper. As a result, there is not much incentive for fleet operators to convert to natural gas, as each natural gas truck costs around $50,000 more than a diesel truck. However, fleet operators are still buying natural gas-powered trucks. This is not surprising as natural gas engines can deliver identical power and acceleration as compared to diesel engines, but at the same time, natural gas is around 50% cheaper than gasoline or diesel. This will help fleet operators record major savings in the long run. For instance, a class 8 truck in the U.S. runs around 67,000 miles a year as per the Federal Highway Administration , and has a mileage of 5.2 miles per gallon of gasoline. Now, considering a conversion cost of around $50,000 per truck, a fleet operator will be a able to record strong savings as shown below: (click to enlarge) Source Hence, fleet owners will continue converting into natural gas, and this will be a tailwind for Clean Energy. As a result, it is not surprising to see that the company has signed new agreements with Potelco and Dean Foods (NYSE: DF ) to refuel their natural gas fleets. The Potelco agreement will enable Clean Energy to fuel 75 heavy-duty LNG trucks. In fact, the company has opened two truck-friendly fuel stations in Arizona and Kansas City that will support 58 CNG trucks for seaboard transport. On the other hand, the agreement with Dean Foods will allow Clean Energy to build a private CNG fueling station to fuel 64 trucks at Dean Foods’ Oak Farms Dairy plant in Houston, Texas. More importantly, Clean Energy is investing in infrastructure in order to improve the adoption of natural gas vehicles. It has opened 16 fueling stations since the beginning of the year as a part of its plan to build around 35 stations for its customers this year. As a result, Clean Energy will benefit from investments by truck makers, engine manufacturers, and other component OEMs that are increasingly focusing on natural gas vehicles. Conclusion The two key points discussed in the article clearly indicate that Clean Energy Fuels’ weak performance is temporary. The advantages of natural gas over diesel will help it get better going forward, and the increase in pricing will be another key catalyst. Thus, it makes sense for investors to buy the drop in Clean Energy’s stock price as it can be a good long-term investment. Disclosure: The author has no positions in any stocks mentioned, and no plans to initiate any positions within the next 72 hours. (More…) The author wrote this article themselves, and it expresses their own opinions. The author is not receiving compensation for it (other than from Seeking Alpha). The author has no business relationship with any company whose stock is mentioned in this article.

Is Targa Resources The Next Energy Sector Takeover Candidate?

Summary In the current low energy price environment, strong companies are looking for assets or companies they can take over on the cheap. Targa Resources Corp. is the general partner of a quality MLP that has suffered with lower energy commodity prices. TRGP is down 35% even as dividend increased 6% every quarter. Several large cap energy midstream companies could start a bidding war for TRGP. A 30% premium on the current share price is not out of the question. The steep declines in the energy commodity prices have led to speculation about mergers or acquisitions in the sector. I primarily follow the MLP and related companies, and so far in 2015, acquisition activity has been light. Vanguard Natural Resources LLC (NASDAQ: VNR ) has agreed to acquire a couple of smaller upstream MLPs and Enterprise Product Partners LP (NYSE: EPD ) just announced a $2.1 billion private deal acquisition of gathering and processing assets. Outside of these I can’t think of any meaningful purchases. I think that Targa Resources Corp. (NYSE: TRGP ) could be ripe for a take over offer from an energy midstream company looking to add quality assets and a historically successful midstream operation. Targa Overview Targa Resources Corp. owns the general partner interest and 9.1% of the LP units of Targa Resources Partners LP (NYSE: NGLS ) a $7.9 billion market cap midstream MLP. NGLS generates about 40% of its operating margin from gathering services in Texas and Oklahoma and the balance comes from logistics and marketing, which includes the following services: Targa Resources Corp. has used the GP incentives growth model to produce a high level of dividend growth compared to the NGLS distribution growth rate. If you are not familiar with the GP growth potential, I covered how the partnership system works in this article . Over the last three years the TRGP dividend has increased 27% up to 35% year over year every quarter. This growth in the TRGP dividend was fueled by high single digit distribution growth at the MLP level. Targa Resource Partners has aggressively developed and acquired midstream assets. The company has invested over $2 billion in organic capex since 2012, bringing $1 billion worth of projects online in each of the last two years. In addition, over $8 billion in acquisitions have closed over the last three years. In February Targa Resources closed its acquisition of Atlas Pipeline Partners, LP and Atlas Energy, LP. Commodity Price Declines Slow DCF Growth In the current slower drilling and lower energy price environment, Targa Resources Partners most recent guidance is for 4% to 7% distribution growth in 2015 with 1.0 times distributable cash flow coverage. In 2014 the NGLS distribution grew by 8% on 1.5 times DCF coverage. The Targa Resources Corp dividend guidance for 2015 is 25% growth, compared to 27% growth in 2014. The market has noticed the significant drop in DCF coverage at the MLP level, pushing down the NGLS and TRGP share prices by 30% and 35% respectively since last September. In 2015, the TRGP share price has cycled a couple of times between about $90 and $107. In the last 6 weeks the price has dropped from the $107 cycle peak to currently trade around $90. Reasons for the decline seem to be around falling energy commodity prices and the failure of TRGP to announce some sort of MLP roll up plan similar to the recent Kinder Morgan Inc. (NYSE: KMI ) and Williams Companies (NYSE: WMB ) moves. See: Income Power Couple: Stacking Kinder Morgan Against Williams Companies The steep share price decline has pushed the TRGP yield up to 3.6%, well above the low 2% yield the company carried last year and the 2% to 2.5% rate the market current puts on 25% high visibility dividend growth. It seems that the market does not believe that this year’s growth guidance will be met and prospects have slowed for Targa Resource Partners in the longer term. Potential Acquirers In spite of the current downturn in values, the Targa Resources companies have a high quality book of assets and operations. The company’s gathering assets are in the heart of the Permian basin and the processing, storage and export assets are in prime locations on the Gulf Coast. To acquire these assets would be a boost to one of several large cap midstream companies. If a company buys up TRGP as the general partner, the MLP is then controlled, to be merged with other assets or left as a stand alone partnership. Here are a couple of large cap MLPs that would benefit from the acquisition of Targa Resources Corp and have the resources to make a $6 billion or higher bid for the company. Enterprise Product Partners : With its $60 billion market cap, EPD needs to make meaningful acquisitions to move the needle. The Targa assets would dovetail in nicely with the Enterprise holdings. EPD made a similar acquisition last year by first buying the privately held Oiltanking GP interests and then later making an offer for the publicly traded Oiltanking LP units. Williams Companies likes to view itself as one of the major natural gas infrastructure players. Acquiring Targa would be similar to last year’s absorption of Access Midstream Partners. Williams first picked up all of the Access GP ownership and then merged the MLP into Williams Partners. Energy Transfer Equity LP (NYSE: ETE ) : The Energy Transfer group has been a more of build by acquisition set of businesses. Last year they made a run at Targa, but nothing came of it. I would not surprise me if Energy Transfer made another offer for the company. If one of the listed companies made an offer for TRGP, it would not be a surprise to see a bidding war break out. An offer of $120 per share might be enough to obtain the company. Disclosure: The author is long TRGP, KMI, WMB. (More…) The author wrote this article themselves, and it expresses their own opinions. The author is not receiving compensation for it (other than from Seeking Alpha). The author has no business relationship with any company whose stock is mentioned in this article.