Tag Archives: seeking-alpha

Best And Worst: Small Cap Growth ETFs, Mutual Funds And Key Holdings

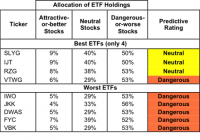
Summary Small Cap Growth style ranks 10th in 2Q15. Based on an aggregation of ratings of 11 ETFs and 498 mutual funds. SLYG is our top rated Small Cap Growth ETF and VSCRX is our top rated Small Cap Growth mutual fund. The Small Cap Growth style ranks 10th out of the 12 fund styles as detailed in our 2Q15 Style Rankings report . It gets our Dangerous rating, which is based on an aggregation of ratings of 11 ETFs and 498 mutual funds in the Small Cap Growth style. Figures 1 and 2 show the five best and worst rated ETFs and mutual funds in the style. Not all Small Cap Growth style ETFs and mutual funds are created the same. The number of holdings varies widely (from 29 to 1214). This variation creates drastically different investment implications and, therefore, ratings. Investors seeking exposure to the Small Cap Growth style should buy one of the Attractive-or-better rated ETFs or mutual funds from Figures 1 and 2. Figure 1: ETFs with the Best & Worst Ratings – Top 5 (click to enlarge) * Best ETFs exclude ETFs with TNAs less than $100 million for inadequate liquidity. PowerShares Fundamental Pure Small Growth Portfolio ETF (NYSEARCA: PXSG ) and Vanguard S&P Small Cap 600 Growth (NYSEARCA: VIOG ) are excluded from Figure 1 because their total net assets are below $100 million and do not meet our liquidity minimums. Figure 2: Mutual Funds with the Best & Worst Ratings – Top 5 (click to enlarge) * Best mutual funds exclude funds with TNAs less than $100 million for inadequate liquidity. Transparent Value Small Cap Fund ( TVSIX , TVSFX ) and Oak Associates River Oak Discovery Fund (MUTF: RIVSX ) are excluded from Figure 2 because their total net assets are below $100 million and do not meet our liquidity minimums. State Street SPDR S&P 600 Small Cap Growth (NYSEARCA: SLYG ) is our top-rated Small Cap Growth ETF and Virtus Small-Cap Core Fund (MUTF: VSCRX ) is our top-rated Small Cap Growth mutual fund. SLYG earns a Neutral rating and VSCRX earns an Attractive rating. One of our favorite stocks held by Small Cap funds is Universal Insurance Holdings (NYSE: UVE ), which earns a Very Attractive rating. Since 2009, Universal Insurance has grown after-tax profit ( NOPAT ) by 21% compounded annually. In addition to its NOPAT growth, the company has increased its return on invested capital ( ROIC ) to 39% in 2014, up from 16% in 2011. Economic earnings have also been positive since 2007. Despite the impressive profit growth achieved by Universal Insurance, the stock remains undervalued. At its current price of $24/share, UVE has a price to economic book value ( PEBV ) ratio of 0.9. This ratio implies the market expects Universal Insurance’s NOPAT to decline by 10% from current levels. However, as noted above, Universal has grown NOPAT by double digits over the past five years. If Universal Insurance Holdings can grow NOPAT by just 8% compounded annually for the next 10 years the stock is worth $38/share today – a 58% upside. Vanguard Small-Cap Growth ETF (NYSEARCA: VBK ) is our worst rated Small Cap Growth ETF and AllianzGI Ultra Micro Cap Fund (MUTF: GUCAX ) is our worst rated Small Cap Growth mutual fund. VBK earns a Dangerous rating and GUCAX earns a Very Dangerous rating. One of our worst rated stocks held by GUCAX is Cardiovascular Systems (NASDAQ: CSII ), which earns our Dangerous rating. NOPAT losses have increased every year since 2012, expanding from -$14 million to over -$33 million in 2014. ROIC has also been negative each year since 2012 and is currently -32%. This equates to Cardiovascular Systems destroying 32 cents of every dollar invested into the business. Despite all of this, CSII’s stock price does not reflect the company’s deteriorating performance. Since 2012, the stock has tripled in price. When considering the fundamental performance of the company over this period, we believe the stock to be overvalued. To justify its current price of $29/share, the company would need to achieve positive pretax margins immediately and grow revenue by 35% compounded annually for the next 18 years . This seems very optimistic given that the company has never grown revenue above 31% year over year, and has remained unprofitable while doing so. Figures 3 and 4 show the rating landscape of all Small Cap Growth ETFs and mutual funds. Figure 3: Separating the Best ETFs From the Worst ETFs (click to enlarge) Figure 4: Separating the Best Mutual Funds From the Worst Funds (click to enlarge) Sources Figures 1-4: New Constructs, LLC and company filings Disclosure: David Trainer and Allen L. Jackson receive no compensation to write about any specific stock, style, style or theme. Disclosure: I/we have no positions in any stocks mentioned, and no plans to initiate any positions within the next 72 hours. (More…) I wrote this article myself, and it expresses my own opinions. I am not receiving compensation for it. I have no business relationship with any company whose stock is mentioned in this article.

3 Small-Cap Growth ETFs To Buy For Q3

Contrary to popular believe, the Fed dove is still to fly far from the border of the U.S. economy. In its latest June meeting, the Fed remained accommodative and hinted at a slower rate hike trail when the step is actually taken. To add to this, the Fed slashed its projection for the benchmark interest rate for 2016 and 2017, though the guidance for the ongoing year was kept unchanged. This indirectly promised investors a few more months of cheap money inflows. On the other hand, the U.S. economy is taking root. Fed officials even went on to say that the rebounding U.S. economy is strong enough to endure one or two rate hikes this year and insisted that the rate hike decision will be solely economic data reliant. The ”soft patch” of Q1 has disappeared with “moderate” economic growth momentum in Q2. The economy wrote a turnaround story with better than expected job growth data along with strong construction spending, automobile sales and housing numbers. Some dampeners of Q1 including a harsh winter and strikes at the Western Coast ports will not be present in Q3, though a relatively stronger greenback (against a basket of currencies) might cause occasional threats to U.S. exports and the large-cap stocks. This economic development set the stage for the small-cap growth ETF’s outperformance. Small cap stocks are broadly leading the market higher this year and are comfortably surpassing their large cap cousins. The ultra-popular small cap ETF iShares Russell 2000 ETF (NYSEARCA: IWM ) is up 6.9% year to date (as of June 19, 2015) against 2.4% gains in the SPDR S&P 500 ETF Trust (NYSEARCA: SPY ) . This trend will likely continue in the coming quarter, presuming that a risk-on sentiment will hang on in the marketplace and the focus will stay on the domestically exposed stocks. Investors should note that small-cap stocks are seen as an indicator of the domestic economy. These pint-sized companies deal mainly with the domestic economy. Due to their less global exposure, these stocks remain relatively less ruffled by a strong dollar. So this part of capitalization would be one of the best bets if the Fed takes the rate hike plunge later on the year. Moreover, indecisiveness is prevalent in the global markets due to Greek debt worries, slowdown in China and Japan, rate issues in the U.S. and the consequent movement in the greenback and finally the volatility in oil prices. These happenings might weigh on large-cap stocks leaving small-cap growth stocks and ETFs as intriguing choices. These growth focused small caps have actually outperformed the broad market small cap ETFs lately by a pretty wide margin and have the potential to carry forward the trend. Small-Cap Growth ETFs Upgraded to Buy Rating Below, we highlight three small-cap growth ETFs all with Zacks Rank #1 (Strong Buy) or #2 (Buy), any of which could be an excellent play in the third quarter. Investors should note that each of these ETFs went through a Zacks rank upgrade recently. SPDR S&P 600 Small Cap Growth ETF (NYSEARCA: SLYG ) This ETF was upgraded from Zacks ETF Rank #3 (Hold) to Zacks ETF Rank #1. The ETF tracks the S&P SmallCap 600 Growth Index. Holding 351 securities, this fund is also well spread out across each sector and security. Each security accounts for less than 1.27%, while sector wise, Financials, Consumer Discretionary, Healthcare, Information Technology and Industrials take the top five spots each with double-digit exposure, leaving a decent allocation for the utilities and telecom sectors. This $575 million fund trades at a paltry volume of 20,000 shares a day suggesting additional cost beyond the expense ratio of 0.15%. The ETF is up 9.6% year to date (as of June 19, 2015). iShares Morningstar Small-Cap Growth ETF (NYSEARCA: JKK ) The product was upgraded from Zacks ETF Rank #3 to #2. This is an overlooked choice in the small cap space with AUM of $141.5 million and average trading volume of close to 2000 shares a day. The 252-stock fund tracks the Morningstar Small Growth Index. It is well spread out across components as none of these holds more than 1.15% of assets. Sector wise, information technology (28.90%), and healthcare (22%) take the top two spots. The fund charges 30 bps in annual fees from investors and has gained 10.4% so far this year. Guggenheim S&P SmallCap 600 Pure Growth ETF (NYSEARCA: RZG ) This ETF was upgraded from Zacks ETF Rank #3 to #1. The fund targets the small cap U.S. market and follows the S&P SmallCap 600 Pure Growth Index. Holding 132 securities in its basket, it is well spread out across components with each holding less than 2.17%. Financials, Healthcare, Consumer Discretionary, Information Technology, and Industrials are the top five sectors with double-digit allocation each. The fund has amassed $166 million in its asset base and trades in light volume of about 20,000 shares a day on average. Expense ratio comes in at 0.35%. The product has surged 14.5% so far in the year. Original Post

5 Stocks Leading XBI Biotech ETF Higher

The biotech corner of the health care space is having a stellar run like last year and still remains a favorite investment destination for investors. This is primarily thanks to strong earnings growth, merger & acquisition frenzy, promising drug launches, cost-cutting efforts, a rise in the aging population, insatiable demand for new drugs, ever-increasing health care spending, expansion into emerging markets and the Affordable Care Act or Obamacare. Further, biotech stocks provide a defensive tilt to the portfolio amid political or economic turmoil. While most of the biotech ETFs has given incredible performances so far in the year, the ultra-popular – SPDR S&P Biotech ETF (NYSEARCA: XBI ) – is not far behind. It is the third best performing ETF in the biotech space, returning nearly 39.5%. XBI in Focus With AUM of $2.3 billion and average daily volume of close to a million shares, XBI is extremely liquid and an easily traded fund. It provides equal weight exposure across 106 stocks by tracking the S&P Biotechnology Select Industry Index. This suggests that the product has no concentration issue and offers huge diversification benefits. The product has a definite tilt toward small cap securities, as mid and large caps account for only around 10% each. It charges a relatively low fee of 35 bps a year for the exposure and has a Zacks ETF Rank of 2 or ‘Buy’ rating with a High risk outlook. Several stocks in the ETF portfolio are worth noting, as these have been the real stars and have contributed much to its outstanding performance. Below, we have highlighted those five best performing stocks and each takes nearly 1% share in the fund’s basket, irrespective of its position: Best Performing Stocks of XBI Eagle Pharmaceuticals Inc. (NASDAQ: EGRX ): Based in Woodcliff Lake NJ, this specialty pharmaceutical company is focused on developing and commercializing injectable products, primarily in the critical care and oncology areas in the United States. Having a Zacks Rank of #3 (Hold), the stock surged nearly five-folds in the year-to-date time frame given its incredible growth prospect with a Growth Style Score of ‘A’. The company’s earnings are expected to grow a whopping 137.90% this year compared to industry growth projection of 9.75% and sales growth projection is also robust at 264.47% versus the industry average of 4.43%. The stock also has a solid Zacks Industry Rank in the top 39% at the time of writing. Heron Therapeutics Inc. (NASDAQ: HRTX ): Based in Redwood City, CA, this biotech company develops products using its proprietary Biochronomer polymer-based drug delivery platform to address unmet medical needs. The stock has delivered incredible returns of over 215% so far in the year and is still showing solid momentum with a Momentum Style Score of ‘A’. The stock has seen narrowing loss estimate from $2.78 per share to $2.56 per share over the past 60 days, suggesting some upside. This represents earnings growth of 10.9% year-over year, up from the industry average of 1.5% growth. HRTX has a Zacks Rank #3 and a solid Zacks Industry Rank in the top 41%. Exelixis Inc. (NASDAQ: EXEL ): The stock was recently upgraded by a notch to Zacks Rank #2 (Buy), and has climbed nearly 180% so far this year. Based in South San Francisco, the company develops and sells small molecule therapies for the treatment of cancer in the United States. Though the company’s earnings are expected to grow 42.79% year over year this year, well above the industry average of 6.43%, earnings yield is highly negative at 20.31% and worse than the industry average of 7.84%. As such, the stock currently does not pose ideal flavors of growth, value and momentum. However, it falls in a strong industry category, having a Zacks Rank in the top 42%. Retrophin Inc. (NASDAQ: RTRX ): Based in San Diego, CA, this biopharma company focuses on the development, acquisition and commercialization of drugs for the treatment of serious, catastrophic or rare diseases for which there are currently no viable options for patients. The stock, with an industry Zacks Rank in the top 42%, has gained 177% in the year-to-date time frame. Though the company’s earnings and revenues are expected to grow more than the industry average this year, its growth and value prospects are gloomy with a Growth Style Score of ‘D’ and Value Style Score of ‘F’. This is because the stock has a Zacks Rank #4 (Sell) and seen massive negative estimate revisions from a loss of 96 cents per share to a loss of $1.64 per share for the current fiscal year. This suggests some pain for this company in the coming weeks. Prothena Corp Plc (NASDAQ: PRTA ): The stock has delivered robust returns of 159% so far this year but the trend of outperformance is likely to snap in the coming weeks. This is especially true as this Zacks Rank #3 stock also has a dull Growth and Value Style score of ‘F’ each despite the strong industry Zacks Rank in the top 42%. Earnings and revenues are expected to decline 796.5% and 95.3%, respectively, for this year. Based in Dublin, Ireland, Prothena is a late-stage clinical biotechnology company focused on the discovery, development, and commercialization of protein immunotherapy programs for the treatment of diseases that involve amyloid or cell adhesion. Original Post