Tag Archives: seeking-alpha

How To Find The Best Style Mutual Funds: Q2’15 In Review

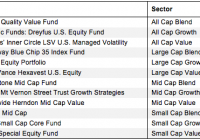
Summary Finding the best mutual funds is an increasingly difficult task in a world with so many to choose from. Performance of a mutual fund’s holdings equals the performance of the fund. Our coverage of mutual funds leverages the diligence we do on each stock by rating mutual funds based on the aggregated ratings of their holdings. Finding the best mutual funds is an increasingly difficult task in a world with so many to choose from. How can you pick with so many choices available? Don’t Trust Mutual Fund Labels There are at least 904 different Large Cap Value mutual funds and at least 6391 mutual funds across twelve styles. Do investors need 500+ choices on average per style category? How different can the mutual funds be? Those 904 Large Cap Value mutual funds are very different. With anywhere from 17 to 1003 holdings, many of these Large Cap Value mutual funds have drastically different portfolios, creating drastically different investment implications. The same is true for the mutual funds in any other style, as each offers a very different mix of good and bad stocks. Large Cap Value ranks first for stock selection. Small Cap Blend ranks last. Details on the Best & Worst mutual funds in each style are here . A Recipe for Paralysis By Analysis We firmly believe mutual funds for a given style should not all be that different. We think the large number of Large Cap Value (or any other) style mutual funds hurts investors more than it helps because too many options can be paralyzing. It is simply not possible for the majority of investors to properly assess the quality of so many mutual funds. Analyzing mutual funds, done with the proper diligence, is far more difficult than analyzing stocks because it means analyzing all the stocks within each mutual fund. As stated above, that can be as many as 1003 stocks, and sometimes even more, for one mutual fund. Any investor worth his salt recognizes that analyzing the holdings of a mutual fund is critical to finding the best mutual fund. Figure 1 shows our top rated mutual fund for each style. Figure 1: The Best Mutual Fund in Each Style Sources: New Constructs, LLC and company filings How To Avoid “The Danger Within” Why do you need to know the holdings of mutual funds before you buy? You need to be sure you do not buy a fund that might blow up. Buying a fund without analyzing its holdings is like buying a stock without analyzing its business and finances. No matter how cheap, if it holds bad stocks, the mutual fund’s performance will be bad. PERFORMANCE OF FUND’S HOLDINGS = PERFORMANCE OF FUND If Only Investors Could Find Funds Rated by Their Holdings The Eaton Vance Hexavest U.S. Equity Fund (MUTF: EHUIX ) is the top-rated Large Cap Value mutual fund and the overall best fund of the 6391 style mutual funds that we cover. The worst mutual fund in Figure 1 is the Royce Special Equity Fund (MUTF: RSEIX ), which gets our Neutral rating. One would think mutual fund providers could do better for this style. Disclosure: I/we have no positions in any stocks mentioned, and no plans to initiate any positions within the next 72 hours. (More…) I wrote this article myself, and it expresses my own opinions. I am not receiving compensation for it. I have no business relationship with any company whose stock is mentioned in this article.

Adrenaline Investing And Public Power Corporation Of Greece

Greek stock market = adrenaline. There are some interesting value plays in this market. Nevertheless, Public Power Corporation does not look like one of them. Some investors have already decided it is time to bet on Greek stocks, some still hesitate, and for some it is unacceptable to even think about it. In one of my previous articles I have presented some thoughts on Greek telecommunication operator OTE. Today, I would like to continue by looking at Public Power Corporation of Greece ( OTC:PUPOF ), a Greek company engaged in the electricity generation, transmission and distribution; it owns lignite mines, conventional thermal and hydroelectric power plants. PPC trades with P/E (TTM) at 15.65. Czech power company CEZ trades with PE at 15.28, Spanish Iberdrola with PE at 17.59, Austrian Verbund at 38.8, Italian Enel at 86.0, German EON is in red and RWE has PE at 11.9. Comparing PPC with median valuation therefore indicates it does not trade with significant discount. Nevertheless, I would not draw strong conclusions from this type of comparison. I believe, it is more helpful to look at the cash flow of the Company: (click to enlarge) Operating cash flow decreased significantly in 2014. While the company earned EUR 1 billion in 2013, it generated only EUR 435 million in 2014. The reason is not a sharp decline in profitability, though. Operating cash flow declined mostly due to sharp increase in receivables, which mostly reflects deteriorating situation in the whole economy. PPC cut CapEx in 2014 but its cash flow after CapEx was still deeply in red. Needless to say, should this become a standard performance in the coming years, it is hard to find any value in the stock. What if the performance returned to a standard set in 2013? The company generated EUR 138 million after CapEx (and interest expenses). This is the cash flow that is available to principal payment and/or to shareholders. Let`s consider an optimistic scenario: This cash flow represents free cash flow to equity and the situation in the Greek economy soon returns back to stability. We can therefore apply risk free rate of 0,8 % (current yield of the German Bunds) and risk premium of only 5,5 % (see this for some discussion on market risk premiums). Based on the data from FT, PPC has quite high beta (1,55). In this scenario, the required rate of return (based on standard CAPM model) would reach 9,32 %. Now, let`s assume the free cash flow to equity will be constant – it will not grow in the future. The present value of this cash flow would then reach EUR 858 million. If the cash flow grew by 2 % annually, its present value would be EUR 1.09 billion. How do the presented estimates compare to the current market cap? Interesting enough, current market cap is at EUR 1.09 billion. My reading of this situation is that the market is extremely optimistic. Current market cap is hard to justify without assuming significant improvement in cash flow generation and a decline of the risk premium. There was some y-o-y improvement in the cash flow in Q1 2015 (and it was mostly due to working capital). But it is hard to extrapolate these results to the whole year. And a significant decrease of the market risk premium is currently only a finance fiction. OTE may be the last significantly undervalued stock in the world as far as its company-specific situation is concerned. I believe the same can hardly be said about PPC. Editor’s Note: This article discusses one or more securities that do not trade on a major U.S. exchange. Please be aware of the risks associated with these stocks. Disclosure: I/we have no positions in any stocks mentioned, and no plans to initiate any positions within the next 72 hours. (More…) I wrote this article myself, and it expresses my own opinions. I am not receiving compensation for it (other than from Seeking Alpha). I have no business relationship with any company whose stock is mentioned in this article.

Will Iran Keep USO Down?

Iran’s potential nuclear deal could bring up its output in the coming years. Will this deal have a long-term impact on oil market and the price of USO? U.S. oil production keeps rising despite low rig count. The potential nuclear deal between Iran and the West, which could lift the sanctions on the country, has contributed to the decline in the price of The United States Oil ETF, LP (NYSEARCA: USO ) – the oil ETF lost over 6% on Monday and over 10% in the past month. Moreover, the weakness in China, high volatility in the foreign exchange markets over the Greek debt crisis and low oil rig counts in the U.S. also provided additional downward pressure on USO. But is Iran likely to have such a strong impact on the price of USO over the coming years? Despite the sharp rise in volatility in the oil market, the price of USO hasn’t deviated by much from the price of oil in the past couple of months – the roll decay due to the Contango wasn’t harsh. If the futures oil market keeps a low Contango or even move to backwardation, this could behoove USO investors. But the main problem remains on whether oil prices were to bounce back from its recent plunge. One factor to consider is the role of Iran in the oil market. As the EIA showed , Iran’s ability to resume its pre-sanctions oil output on the conditions of the oil fields and infrastructure – it could take time and investment to bring these fields online. Nonetheless, the potential impact of Iran’s higher output could result in low oil prices by $5 to $15 next year. These projections could be a bit too harsh considering the market conditions are harder to increase production and OPEC already exceeds its current quota. Also, the country is likely to face challenges and a more competitive oil market environment. Some of these challenges include rising oil yield of U.S. oil producers, slower growth in demand for oil in China, growing share of Saudi Arabia from OPEC’s total output, and stronger competition from Russia, which heavily relies on oil revenue and continues to face a weak currency. The market conditions have also cut down the oil exports (in U.S. dollar) of OPEC in general and Iran in particular in the past year. As I have already pointed out in the past, and based on OPEC statistical bulletin , in 2014, OPEC’s revenue from petroleum exports have gone down to $964 billion – a 12.6% fall, year on year. For Iran the revenue from output also declined, mainly between 2012 and 2013 on account of its sanctions. (click to enlarge) Source of data taken from OPEC So the potential end of the sanctions on Iran could bring back up the country’s oil revenue, even though, as presented above, the fall in revenue of OPEC also suggests it will be harder to increase oil exports in the current market conditions. Currently, Iran produces around 2.8 million barrels per day. Back in 2011, before the sanction, the country was able to produce roughly 3.6 million bbl/day – 28% higher than in 2015. Last year, it produced 3.1 million bbl per day of which only 1.1 million bbl/day were exported or 35% of total output. Over the next couple of years, assuming the sanctions are lifted, Iran could increase its total output by 700,000 bbl/day, according to the EIA . Considering the country’s energy demand keeps rising, the county is likely to partly use this added output towards its own energy needs. In the meantime, the output in the U.S. hasn’t contracted, despite the fall in rig counts in the past few months. Oil producers have also reduced their capex for 2015 and in some cases for 2016. But for now, the output hasn’t contracted and the EIA still projects the annual output will remain around 9.4 million bbl per day – only 2% lower than the current output level. (click to enlarge) Source of data taken from EIA and Baker Hughes Looking forward, the EIA estimates production will fall further in 2016 to 9.3 million bbl per day. The fall in output in the coming months could also bring back up oil prices or at the very least ease the downward pressure on oil prices. Even though Iran’s role in the oil market is very important and could have an adverse impact on the price of oil and USO, its impact could actually be less prominent considering the current market conditions and the country’s energy demands. (For more please see: ” USO Investors – Beware of The Contango! “) Disclosure: I/we have no positions in any stocks mentioned, and no plans to initiate any positions within the next 72 hours. (More…) I wrote this article myself, and it expresses my own opinions. I am not receiving compensation for it (other than from Seeking Alpha). I have no business relationship with any company whose stock is mentioned in this article.