Tag Archives: seeking-alpha

Which U.S. REIT ETF Has The Best Dividend Growth?

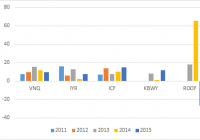
Summary REIT ETFs have attracted investor interest in the prevailing low interest rate environment. This article studies the dividend growth history of four U.S. REIT ETFs. Data are analyzed to identify the REIT ETF with the highest yield, the highest dividend growth rate and the highest “Chowder number”. Introduction The current low-interest rate environment has stimulated interest in income-generating securities such as real estate investment trusts [REITs]. Investors uncomfortable with picking individual stocks may prefer to invest in REIT ETFs. The Vanguard REIT Index Fund (NYSEARCA: VNQ ) is the largest REIT ETF, with over $25B in assets. Besides providing a relatively high yield, REITs can also grow their distributions. This article seeks to compare the dividend growth history of five U.S. REIT ETFs to determine which fund has the best dividend growth characteristics. The funds The funds chosen were VNQ, the iShares U.S. Real Estate ETF (NYSEARCA: IYR ), the iShares Cohen & Steers REIT ETF (NYSEARCA: ICF ), the KBW Premium Yield Equity REIT Portfolio (NYSEARCA: KBWY ) and the IQ US Real Estate Small Cap ETF (NYSEARCA: ROOF ). VNQ, IYR and ICF were chosen as these were the three largest REIT ETFs by assets under management [AUM]. KBWY and ROOF were chosen as these represented small/mid-cap REIT ETFs. Note that ROOF also contains some exposure to mortgage REITs [mREITs] such as New Residential Investment Corp (NYSE: NRZ ), which is currently its top holding. Details for the five REIT ETFs are shown in the table below (data from Morningstar ).   VNQ IYR ICF KBWY ROOF Yield [ttm] 3.86% 3.69% 3.20% 5.21% 5.18% Expense ratio 0.12% 0.45% 0.35% 0.35% 0.69% Inception Sep 2004 Jun 2000 Jan 2001 Dec 2010 June 2011 Assets $25.9B $4.43B $3.20B $113M $92.6M Avg Vol. 4.0M 10.2M 333K 23.7K 22.3K No. holdings 144 115 30 30 68 Avg. Cap $8.8B $11.6B $17.6B $1.8B $1.5B Annual turnover 8% 21% 8% 27% 17% Morningstar rating *** *** ** ***** ***** As can be seen from the chart above, VNQ, IYR and ICF are very large REIT funds, with billions of dollars in AUM. By comparison, KBWY and ROOF are much smaller, with around $100 million in assets. Additionally, the average market capitalization of VNQ, IYR and ICF range from $8.8B to $17.6B, while KBWY and ROOF, being mid/small-cap REIT ETFs, have much smaller average market capitalizations of $1.8B and $1.5B, respectively. In terms of expense ratio, VNQ is the cheapest at 0.12% while ROOF is the most expensive at 0.69%. Finally, KBWY has the highest yield of 5.21%, while ICF has the lowest yield of 3.20%. Dividend grow th history Only three of the funds in this study, VNQ, IYR and ICF, existed before the financial crisis in 2008-2009. Moreover, all three funds cut their distributions in the recession. Therefore, only the last six years of dividend history will be considered. Year-on-year dividend growth The following chart shows the year-on-year dividend growth for the five funds since 2011. Since only the first two quarters of dividends of 2015 have been declared thus far, the dividend growth % shown for “2015” actually represents the growth of the dividend from the previous 8th to 5th quarters (i.e. 2013 H2 + 2014 H1) to the last 4 quarters (i.e. 2014 H2 + 2015 H1). The same calculation applies to the other years in the chart. The chart above shows that the distribution history for ROOF is extremely lumpy, with a 65% increase in distribution for 2014, followed by a -27% decrease in distribution for 2015. Hence, ROOF was removed from subsequent analysis so that the differences between the other four funds can be more clearly observed. The following chart is the same as the previous one, but with ROOF removed. The chart above shows that all of the ETFs have had quite robust dividend growth over the past 5 years. 3 or 5-year average dividend growth For further comparison, I have computed the average year-on-year dividend growth percentages for each of the funds over either the past 3 or 5 years. We can see from the chart above that VNQ has had the highest dividend growth over both 3-year and 5-year periods, with average year-on-year dividend growth rates of 12.2% and 10.7%, respectively. KBWY had the lowest average 3-year dividend increase of 7.04%. Another way to compare dividend growth rates is the cumulative increase in dividend. The following chart shows the cumulative 3-year and 5-year annualized dividend growth rates of the four funds. Presenting the data in this way shows a similar story. VNQ still has the highest annualized cumulative 3-year and 5-year dividend growth rates of 12.2% and 10.7%, respectively. Chowder numbers The ” Chowder number ” is determined by adding the current yield of a security to the historical dividend growth rate. The Chowder number can be considered as a proxy for the expected total return of a security, assuming that the dividend yield of the asset stays the same. The following chart shows the Chowder numbers of the four funds using the annualized 3-year DGR. We can see from the chart above that VNQ has the highest Chowder number of 16.0%, while IYR has the lowest Chowder number of 11.20%. This suggests that going forward, VNQ might be the best investment from the total return perspective. However, one caveat is that, Chowder numbers are backward-looking and one could question whether or not dividend growth rates of REIT ETFs can be reliably extrapolated into the future. Performance The following chart shows the total return performances for VNQ, IYR and ICF over the past 5 years. The data shows that all three REIT ETFs move closely together, with VNQ leading the pack at 83.6% (12.9% annualized). The following chart shows the total return profiles for the four REIT ETFs over the past 3 years. We see that KBWY has had the best 3-year total return of 40.3% (11.9% annualized), followed by VNQ at 32.7% (9.9% annualized). IYR had the worst performance over both 3-year and 5-year periods. Conclusion This article explored the dividend growth history of three large-cap U.S. REIT ETFs, namely VNQ, IYR and ICF, as well as the mid/small-cap REIT ETF KBWY. However, the “best” REIT ETF may depend on each investor’s personal preference. Looking for the highest dividend growth rate? VNQ had the highest annualized 3-year and 5-year dividend growth rates of 12.1% and 10.7%, respectively. Looking for the highest current yield? KBWY has the highest current yield of 5.21%. Looking for the highest “Chowder number”? Using 3-year dividend growth rates, VNQ has the highest “Chowder number” of 16.0% (3.9% yield + 12.1% DGR). Looking for the best past performance? KBWY had the best total return performance (40.3%) over the past 3 years out of the four REIT ETFs, while VNQ had the best total return performance (83.6%) over the past 5 years out of VNQ, IYR and ICF. Interestingly, the “winner” of each of these categories was either VNQ or KBWY. Another reason to pick VNQ is its cheap expense ratio of 0.12%, which is the lowest out of the four funds. VNQ’s combination of 3.9% yield and 12.1% 3-year dividend growth rate makes this fund my top pick for a U.S. large-cap REIT ETF. On the other hand, KBWY provides exposure to the mid/small-cap segment of U.S. REITs, which offers diversification benefits as well as the potential for higher returns (accompanied by higher volatility). I would pick KBWY over ROOF due to KBWY’s lack of mREIT exposure as well as its more consistent dividend history. Additionally, KBWY pays monthly, which could be a plus for some investors, whereas all of the other REIT funds pay quarterly. Finally, the prevailing worries over interest rate rises has caused the REIT ETFs to drop by about 10% from their recent highs, providing more attractive entry points to income investors. VNQ Total Return Price data by YCharts Disclosure: I/we have no positions in any stocks mentioned, and no plans to initiate any positions within the next 72 hours. (More…) I wrote this article myself, and it expresses my own opinions. I am not receiving compensation for it (other than from Seeking Alpha). I have no business relationship with any company whose stock is mentioned in this article.

When Hedging Makes A Difference

The fund takes advantage of hedging a strong U.S. Dollar against a weak Japanese Yen. The fund is heavily weighted towards industrial and auto manufacturers; major Japanese exports. The fund is passively managed with over 300 companies in the fund. Japan has been struggling to inflate its economy for decades. Immediately after his 2012 reelection, Japanese Prime Minister Mr. Shinzo Abe initiated a ‘three arrow plan’ consisting of fiscal stimulus, monetary easing and structural reforms all intended to attain a 2% annualized inflation rate. Although it was unprecedented and did have an immediate positive effect, the plan soon lost velocity. Complicating the matter, the massive 2011 earthquake and Tsunami which led to the destruction of the Fukushima reactors forced the government to order an immediate shutdown of all nuclear facilities. To replace the lost power generation, oil and gas imports increased dramatically, and by 2012 the increase in fuel imports had created a large trade deficit as demonstrated in the chart. (click to enlarge) Further, a value added tax increase caused consumers to reduce spending. At the very end of October 2014, BOJ Governor Mr. Haruhiko Kuroda unexpectedly announced a sizable expansion of the bank’s existing bond buying program. The Japanese Government Pension Fund simultaneously announced plans to double equity holdings. However, nearly 10 months later, chronic disinflation still persists in the Japanese. Recently, the IMF has called for Japan to expand its stimulus measures still further opining that the Bank of Japan’s current projections are “overly optimistic”. However, Mr. Kuroda considers that the growth policy remains on track and no further actions are required. Is this the right time to have exposure to the Japanese economy in your portfolio? Note though, it isn’t just the Japanese economy investors need to be concerned with. All economies phase in and out of business cycles. However, because of the extreme quantitative stimulus measures implemented for such an extended length of time, and often quite unexpectedly, it would be better to enter a position with a currency hedge. Deutsche Asset & Wealth Management offers the X-tracker MSCI Japan Hedged Equity ETF (NYSEARCA: DBJP ) . The fund’s objective is to track the performance, ” of the MSCI Japan U.S. Dollar Hedged Index. The index is designed to provide exposure to Japanese equity markets, while at the same time mitigating exposure to fluctuations between the value of the U.S. dollar and Japanese yen … ” The index is 100% hedged to the U.S. Dollar, selling Yen forward contracts at the one month forward rate. Should the Yen depreciate, the tracking index as well as the fund’s Net Asset Value is hedged against losses. Consumer Discretionary leads the fund’s sector allocation at 22.26% with 57 holdings, followed by Financials at 19.64% with 53 holdings; Industrials, 19.48% with 67 holdings; Information Technology, 11.14% with 41 holdings; Consumer Staples, 6.67% with 20 holdings; Health Care, 6.30% with 21 holdings; Materials, 5.92% with 28 holdings; Telecom Services, 4.96% with 4 holdings; Utilities, 2.45% with 11 holdings and Energy 0.91% with 5 holdings. (Data from Deutsche Asset & Wealth Management) The fund is weighted towards cyclical industries 47.45%, followed with cyclically sensitive industries at 23.66% and lastly, 16.83% are in defensive holdings. (Data from Deutsche Asset & Wealth Management) Of the 10 most heavily weighted companies, 66% are in cyclical industries, 21% are semi-cyclical and 13% are defensive. (Data from Deutsche Asset & Wealth Management) The leading fund holding is Toyota Motor Corp (NYSE: TM ) , at 6.16% of the fund, 28.166% of the top ten, and 27.668% of all the 58 Consumer Discretionary holdings. The second largest Consumer Discretionary in the top ten is also an auto manufacturer, Honda Motor (NYSE: HMC ) at 1.84%, accounting for 8.41% of the top ten and 8.264% of all consumer discretionary holdings. It’s important to note that the fund’s 10 motor vehicle manufactures add up to 10.425% of the net asset value. This means that 46.833% of the fund’s consumer discretionary holdings are auto manufacturers. Its then worth noting that automobiles and vehicle parts make up over 18% of Japanese exports. (click to enlarge) (Data from OEC) Lastly, almost 35% of Japan’s exports to the U.S. are autos and vehicle parts and just over 9% of the same to China. Hence a sizable portion of the fund is dependent on U.S. and Chinese automobile demand. The fund’s second heaviest weighted sector is financials at 19.64%, numbering 56 institutions. The largest in the top ten are Mitsubishi Financial (NYSE: MTU ) at 3.11%, Sumitomo Mitsui Financial (NYSE: SMFG ) at 1.91% and Mizuho Financial Group (NYSE: MFG ) at 1.65%. These three financials combined comprise 29.96% of the top ten holdings and 33.98% of all financial holdings. Once again, an important caveat needs to be stated here as well. Because of the Bank of Japan’s extraordinary QE policy, Japan’s banks are seeking higher yields overseas, and thus may be incurring higher risk. As noted in the Financial Times last April: … ultra-low BOJ interest rates are causing at Japan’s regional lenders, which have significant deposits but few lending opportunities because of their ageing local customer base…With 10-year JGB yields at 0.34 per cent, regional banks are investing in overseas sovereign debt or buying real estate funds in search of a yield pick-up.. The fourth largest sector is industrials at 19.48% of the fund. Within the top ten, one industrial, Fanuc LTD (FANUY ) , 1.49%, comprises 6.69% of the top ten and 7.649% of the fund’s 67 industrial holdings. Consumer Staples rank 5th at 6.67% and represented by Japan Tobacco ( OTCPK:JAPAY ) at 1.30%, 5.84% of the top ten and 19.23% of all consumer staples. Health Care follows at 6.30% represented by Takeda Pharmaceutical Co ( OTCPK:TKPYY ) at 1.25% of the top ten and 3.251% of all 21 Healthcare holdings. Lastly, Telecommunications is represented in the top ten by KDDI ( OTCPK:KDDIY ) , 1.29%; 5.79% of all top ten holdings and 62% of all telecom holdings. A trade profile of Japan reveals that, as noted, Autos are the lead export at 13%; Vehicle Parts, 5.3%; Integrated Circuits, 2.4%; Industrial Printers, 2.2% and Specialized Machinery, 1.7%. Of total exports to China, Integrated Circuits are 7.51%, followed by Vehicle Parts, 5.10% and Autos, 4.04%. Of total Japanese exports to U.S. Autos are 27.57% followed by Vehicle Parts, 7.40%; industrial Printers, 2.57%; Construction Vehicles, 2.41% and Aircraft Parts 2.33%. South Korea receives a sundry of intermediate industrial products, such as Hot Rolled Iron, 4.60; Raw Plastic Sheeting, 4.45% and Integrated Circuits, 3.90%. Exports to Thailand, a major Automobile manufacturing and assembly center, are Vehicle Parts, 11.59%; Engine Parts, 3.64% and Combustion engines, 2.22%, as well as intermediate iron. Lastly, according to the World Trade Organization, Japan accounts for 3.13% of Commercial Service exports and 3.70% of Commercial Service imports. Hence, automobiles, automobile components, heavy industrial machinery and construction equipment are important to Japan’s economy. Current Bank of Japan policy is maintaining a weaker Yen, with pressure mounting to stimulate the economy even more. This policy makes Japanese export products less expensive to the importers. Since the U.S. is a major importer of Japanese autos and heavy equipment, the Yen/Dollar hedge will offset the risk of a weakening Yen. Further, strengthening U.S. consumer spending bodes well for Japanese auto and electronics manufacturers. (click to enlarge) There are several USD/JPY hedged funds in this space. Based on the best one year returns of the top ten Japan focused funds, five are focused on a specific sector, two on subsets of the broader indices and the remaining three, including the X-Tracker fund are based on the broader indices. A summary comparison of the three broad based indices is presented in the table below. Fund/Inception Tracking Index 1 Year Return Total Assets Shares Outstanding Premium / Discount Distribution Yield Fees Recent Price P/E iShares Currency Hedged MSCI Japan ETF ( HEWJ) 1-31-14 MSCI 27.16% $830.7 million 26.4 million Discount at -0.08% 1.17% 0.48% after waiver $31.68 16.00 DBJP 6-9-11 MSCI 26.39% $1.358 billion 32.00 million Discount at -0.87% 1.74% 0.45% $42.03 17.00 WisdomTree Japan Hedged Equity ETF ( DXJ) 6-16-06 WisdomTree 25.04% $17 billion 314.6 million Discount at -0.49% 2.28% 0.48% $56.47 14.00 The fund is relatively new, having initiated trading in June of 2011. The market yield to date return is 16.42% and the trailing twelve month yield is 11.46% According to the prospectus , the fund is at least 80% invested and tracks the MSCI Japan U.S. Dollar Hedged Index, based on a subset of the Japanese Equity Market. There are 1,891 top tier companies and 3,486 in total in that index. Over the three years the fund has paid dividends totaling $6.55/share, the largest distribution, $3.42849, paid in December of 2014. The fund is currently trading at a slight discount to NAV at -0.87%. The extreme measures the BOJ needed to make weakened the currency considerably against the U.S. dollar. As it is now, it seems that the Yen will remain weak against the dollar for some time to come. Lastly, although the U.S. economy is growing it is doing so at a very moderate pace, whereas China’s rapid expansion seems to have come to a sudden halt, and might even be contracting. However, if indeed contracting, it offers Japan the opportunity to regain its status as the second largest global economy; an important point to consider. Disclosure: I/we have no positions in any stocks mentioned, and no plans to initiate any positions within the next 72 hours. (More…) I wrote this article myself, and it expresses my own opinions. I am not receiving compensation for it (other than from Seeking Alpha). I have no business relationship with any company whose stock is mentioned in this article. Additional disclosure: CFDs, spread betting and FX can result in losses exceeding your initial deposit. They are not suitable for everyone, so please ensure you understand the risks. Seek independent financial advice if necessary. Nothing in this article should be considered a personal recommendation. It does not account for your personal circumstances or appetite for risk.