Tag Archives: seeking-alpha

SRV: Trading At 20%+ Discount To NAV Due To Supply/Demand Imbalance

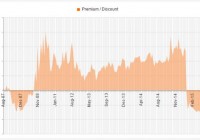
Summary Wave of investor outflows has created a significant dislocation. This provides an opportunity for those constructive on the MLP sector to obtain cheap exposure. For others, it also presents some potential to capture alpha through pair trades. Background on Closed-End Funds For those new to the space, a closed-end fund is a publicly traded investment company that raises a fixed amount of capital, and is then structured, listed and traded like a stock on a stock exchange. Whereas conventional mutual funds and ETFs frequently redeem/issue new shares to ensure that the price per share remains in line with the net asset value of the underlying holdings in the funds, this is not the case for CEFs. Rather, the share price of CEFs is driven by the market forces of supply and demand, which sometimes creates attractive opportunities to buy stakes at big discounts to NAV. This tends to happen when sentiment for the particular sector on which a CEF focuses gets decimated, causing some investors to sell irrespective of price. MLPs are one area where we can see this phenomenon most prevalently today. Amidst plummeting commodity prices and rising rate concerns, investor outflows have caused several MLP-focused CEFs to trade at among the widest discounts to NAV in the CEF universe. This presents some opportunities for those that desire cheap exposure to the sector, as well as those that are agnostic on the sector and just want to collect some alpha. Though there are a few examples of other funds worth considering, including Kayne Anderson Energy Development Co (NYSE: KED ) and Cushing Royalty & Income Fund (NYSE: SRF ), in this article, I focus on the Cushing MLP Total Return Fund (NYSE: SRV ) mainly due to the benefits of its large/liquid portfolio and relatively high institutional ownership. As shown below, SRV is currently trading at a ~22% discount to NAV. (click to enlarge) Source: CEF Connect Cushing MLP Total Return Fund Overview SRV is a moderately sized/liquid fund launched in late 2007, which currently has approximately $209 million of total net asset value. The fund’s mandate is to obtain capital appreciation and current income, typically by investing at least 80% of its NAV in MLPs based upon bottom-up fundamental research. The two partners overseeing the fund (bios included here ) each have several decades of experience in the space. The fund’s performance since inception has been poor, at approximately -7% per annum. However, this largely reflects the general downturn in MLPs/commodities over this period as opposed to poor security selection. As shown below, the current portfolio is diversified across a number of MLP subsectors, and is composed of mostly relatively large, liquid names. Annual portfolio turnover is relatively high (~137%), which I view as a marginal negative due to the fact that this can lead to somewhat higher transaction costs. The fund’s annual management fee is moderate at 0.75%, but its total expense ratio (excluding interest and dividends) is higher than average at approximately 2.6% of NAV. Unlike direct holdings in MLPs, SRV does not generate unrelated business taxable income, and Cushing therefore notes that the fund is suitable for IRAs and other tax-exempt accounts. Source: Cushing What will Cause the Discount to Compress? Whenever sentiment in the MLP sector eventually stabilizes and net investor outflows dry up, it is likely that much of SRV’s discount to NAV will naturally dissipate (for the bulk of the fund’s life, it has actually traded at a premium to NAV as can be seen in the first chart above). However, even if simple supply/demand do not naturally compress the discount, there are a couple of other drivers that could. First, SRV has a moderate annual distribution yield of 6.75% (based on current market price). As part of this represents return of capital, the fund partially self-liquidates over time. In addition, the fund has a reasonably concentrated investor base compared to its peers, with institutions holding approximately 24% of shares outstanding. To the extent that a significant discount were to persist over time, these large investors would be incentivized to pressure management to take additional steps to reduce it (e.g., through buybacks or increased distributions). Source: Nasdaq Trade Structuring For investors that want exposure to MLPs, this CEF provides cheap exposure. However, it also presents some potential opportunity to collect alpha for those that are agnostic (or negative) on the space, through pairing a long position in SRV with a short position in an MLP ETF (either through outright equity or options). Though there are several possible shorts to consider, one of the most actionable is the ALPS Alerian MLP ETF (NYSEARCA: AMLP ). This is a large ETF with approximately $8.4 billion of net assets and average daily trading volume of ~$72 million. It is currently relatively easy to borrow, with a rebate rate under -3.5% through some retail brokers, and also has listed options (which can enable investors to avoid dividend costs). The fund seeks to track the Alerian MLP Infrastructure Index, and 7 of its top 10 holdings overlap with SRV’s top 10. Risks/Considerations The obvious risk of this trade is that the timing of discount convergence is unclear, and if investors’ macro fears over commodities/rates grow, there is a possibility that the discount could grow even larger over the near term. The main mitigants are the facts that, as discussed above, the investor base is relatively concentrated with institutional investors, and the fund pays a moderate distribution yield. Short selling, of course, also comes with added risks (e.g., possibility of force buy-ins, increasing borrow costs, etc.) and likely should not be attempted by those new to the market. Disclosure: I/we have no positions in any stocks mentioned, but may initiate a long position in SRV over the next 72 hours. (More…) I wrote this article myself, and it expresses my own opinions. I am not receiving compensation for it (other than from Seeking Alpha). I have no business relationship with any company whose stock is mentioned in this article.

Biotech Weekly: Position Management And What To Do When You’re In The Red

If a stock that you like drops even though the thesis for holding the stock has not been altered, consider it as an opportunity to add on weakness. BLUE presented a textbook example on Friday of when to add to a position when a stock is acting weak even though the bull thesis remains unchanged. Roka Biosciences may come in with weak Q2 earnings, which would be a great buying opportunity as the thesis is built on H2 sales momentum with the improved listeria assay. Completing thorough due diligence before buying allows you to properly manage your position and provides you the conviction to add to your position on weakness. Welcome to this week’s edition of Biotech Weekly. The past week was rough for biotech investors with the iShares NASDAQ Biotechnology ETF (NASDAQ: IBB ) declining 3.6% and the more small cap SPDR Biotech ETF (NYSEARCA: XBI ) dropping 7.1%. With the rough action, both the IBB (-0.1%) and the XBI (-6.0%) are now down for the quarter, though its important to note that they are both still up significantly year-to-date. XBI data by YCharts With the recent volatility in both small and mid cap names, I’ve seen a number of biotech investors discussing making changes to their portfolios based on the profit/loss of their holdings. While I understand how it can be extremely frustrating to be underwater in a position, it is not smart or logical to make changes to your portfolio based on your unrealized gain/loss, with the one exception being strategic tax-loss trading near the end of the year. While unrealized gain/loss is a measure of how much you have lost or gained in market value since your original investment, it is not a pertinent statistic when considering the proper valuation of a security. I want to use this piece to discuss some of what I believe are important things to consider during the life of a holding and run through a few examples. When You Buy A Stock: By the time you purchase a stock, you should have completed the following tasks: Significant due diligence Review of pipeline assets and science supporting development Identification of near-term catalysts Research on the management team Consideration of the major investors in the stock Acknowledgement of companies with potentially competing treatments Thorough review of upside/downside depending on potential upcoming news Study of the capital structure Examination of the financial statements Understanding of cash runway Determining what the appropriate valuation is for the asset Thesis: From considering these factors above, you should be able to develop a thesis that explains your reasoning for holding the stock. This thesis should cover your belief why the stock will appreciate in value. Example #1: Roka Biosciences (NASDAQ: ROKA ): Back in November 2014, I looked into Roka Biosciences in some detail, but had concluded that it would be best to wait on the sidelines for another earnings report or two given that issues with false positives from the company’s Atlas Listeria LSP Detection Assay would hamper sales. After continuing to watch newsflow surrounding the company, seven months later at the end of June 2015, I highlighted Roka as a top name to buy and presented the following thesis: Pent-up sales demand for the company’s improved listeria assay projected to be cleared in July would fuel sales growth in H2 for this company trading under cash as of its last report with a solid management team and high institutional ownership that has held the stock during past weakness. Example #2: bluebird bio, Inc. (NASDAQ: BLUE ): For the second example, I wanted to present a more mainstream biotech that has experienced some recent significant volatility. Let’s discuss the example of an investor that purchased bluebird on June 24 at $170, the day after the company announced strong pricing for its common stock offering. Let’s present the following thesis that is probably similar to what many investors in bluebird believe: This gene therapy leader with a cash runway into 2018, has an exciting asset in LentiGlobin with two compelling indications (beta-thalassemia major and severe sickle cell disease) and potential data for both indications in December at ASH, an additional late-stage asset in Lenti-D, and numerous immuno-oncology collaborations likely to provide increased newsflow in 2016 presents the opportunity to invest in a new wave of technology progressing towards commercialization. Evaluating Your Position: Managing your position isn’t something that ends after you make a purchase. As an investor, your job has only begun. You are responsible for tracking how newsflow may affect the company and your thesis. If an event happens to disprove your thesis, you likely should be selling out and moving on. If the stock hits what you believe is the fair valuation and no longer presents an attractive risk/reward, you should be reducing/selling your position. Even if the stock has rallied a lot yet still presents a respectable valuation, there is nothing wrong with taking a little bit off the table, as no one has been hurt by taking a little profit. If the stock declines and your thesis remains intact, you should be adding to your position, not dumping your stock (“puking up” your position as traders say). I’ve never been a huge fan of stop losses as they can cause you to sell a stock in a market correction (such as what biotech has been experiencing recently) just because investors are going “risk-off” and not because of any company-specific news. Let’s walk through the two examples. Example #1: Roka Biosciences: Since buying ROKA in mid June, I saw the stock rise approximately 36% into a mid July announcement that the company had indeed received AOAC clearance for its improved listeria assay . I did not trim any of my position off over $3.50, as I firmly believe the stock has substantially more upside than this once the pent-up sales demand is released. I believe the stock has a good chance to return to the $8+ price per share levels where it traded before issues with false positives for its original listeria assay. When I saw the stock fade over the next few weeks, I asked myself if my thesis was still intact. After review, I determined that my thesis was indeed still intact, and the investment was actually derisked slightly given that the company had achieved the AOAC clearance. Given this, I decided to purchase more shares this month. That being said, I have been very clear that I expect Q2 sales to be poor. I started my position before Q2 earnings as I felt the current depressed valuation around cash levels, the AOAC clearance catalyst, and the potential for H2 sales momentum would provide some support and allow me to participate in upside if the company is indeed able to pull a rabbit out of its hat in terms of sales progress in Q2. Should shares drop on weak Q2 earnings, my thesis will remain intact, and this drop would be a great (and potentially last) buying opportunity. Example #2: bluebird bio, Inc.: After bouncing around between $155 and $170 per share after the offering, the stock declined from a high of $168.03 on August 6 to a low of $129.01 only a day later. So, what caused the stock to tank more than 23% in this short period of time? The company had provided its second quarter operating results in a press release on August 6 , but there wasn’t anything particular of note. The thesis I presented above remained fully intact. Selling merely appeared related to a risk-off theme of selling every biotech in sight, especially if they did not have a major catalyst this quarter. There’s no reason to sell the stock just because your profit/loss line in your account now shows you at a loss. An investor that had bought the stock after the most recent offering given the thesis I presented would certainly have been downright confused by the significant drop, but should have taken the drop as a gift and added to the bluebird position. Many investors certainly realized that the stock was being inappropriately beaten down as it proceeded to rally over 25 points in a half-day of trading. What type of stock has a 25-point intraday rally in a weak market? A stock that shouldn’t have been receiving a beating in the first place. Who was selling bluebird below 140? It certainly didn’t make sense for me. Those that had bought recently should have been adding if anything as their investment thesis likely remained intact. Those that bought the stock much lower should have been selling in the $160-170 range if they felt the stock was fairly valued, not dumping shares after a decline over 20% after parts of two trading days. Conclusion: Don’t jump into stocks until completing thorough due diligence. This through due diligence allows you to properly manage your position. Make sure to develop a solid thesis, which you can see play out by tracking newsflow. If a stock that you like and believe presents a reasonable valuation drops even though the thesis for holding the stock has not been altered (as we saw with bluebird on Friday), consider this an opportunity to add to your position on weakness, not blindly dump your shares as the stock declines for no significant company-specific reason Editor’s Note: This article covers one or more stocks trading at less than $1 per share and/or with less than a $100 million market cap. Please be aware of the risks associated with these stocks. Disclosure: I am/we are long ROKA. (More…) I wrote this article myself, and it expresses my own opinions. I am not receiving compensation for it (other than from Seeking Alpha). I have no business relationship with any company whose stock is mentioned in this article.

REM And The mREITs

Summary The mREIT sector faces a few headwinds. Book value for most mREITs fell hard in the second quarter, but the prepayments were a much larger economic problem than the widening of spreads. Wider spreads are painful as they come into existence, but they are healthy. The iShares Mortgage Real Estate Capped ETF (NYSEARCA: REM ) can be viewed in a few manners. Some people may analyze it as a traditional ETF filled with companies that have a similar line of work, while others may try to tackle it at a more macroeconomic level. In my opinion, a macroeconomic view of REM makes sense. While REM is an ETF, it is filled with mREITs which in turn act as option-embedded leveraged bond funds. Investors choosing to buy REM are most likely doing it for the yield on the ETF rather than for capital appreciation, however it is wise to understand the factors that will influence the level of dividends that can be paid by the underlying securities. The Underlying Securities REM’s top 10 holdings are displayed below: (click to enlarge) The top 2 holdings, Annaly Capital Management (NYSE: NLY ) and American Capital Agency Corp. (NASDAQ: AGNC ), make up just over 26% of the portfolio. These mREITs frequently will at least modify their exposures to the MBS market. For instance, Annaly Capital Management recently announced that they would begin diversifying into non-Agency MBS. That sounds like a good move since it should reduce volatility that comes from having a portfolio that was too heavily focused. American Capital Agency Corp. on the other hand decided to modify their strategy lately by reducing leverage due to expectations for movements in prices that would negatively impact mREITs with higher levels of leverage. In short, investors should recognize that each mREIT may be slightly different from one quarter to the next in their holdings which causes the overall the risk profile to change for each security. Despite having a fairly heavy focus on the top few securities there is still a fairly reasonable amount of diversification within the ETF. Therefore, investors will want to consider what factors can influence the performance of the entire sector. Sector Headwinds Generally speaking the mREITs will own long-term loans in the form of MBS and use a moderate amount of hedging closer to the middle of the yield curve. They will finance the position with short-term borrowing. For an mREIT that is going to hedge heavily the difference between the yield on their long-term MBS assets and the rate they pay on their interest rate swaps is critical in determining how much income the mREIT can make. For an mREIT that does substantially less hedging, the short-term rates on their repo agreements are extremely important. Going light on hedges means more risk but higher returns if the repo rates stay low. The risk of short-term rates increasing materially over the next few years is a real challenge to mREITs. If they hedge out most of the risk with heavy use of interest rate swaps, their potential income is severely limited. If they do not hedge heavily against the risks then increases in repo rates could hammer their net interest income, while declining values of MBS (yields up, prices down) would hammer their book value. The Ugly Beast of Refinancing A major challenge for mREITs has been the availability of refinancing options because the loans are sold to the mREITs at a premium to par which means a very early repayment of the loan results in material losses of book value for the mREITs. Refinancing is an ugly negative sum game. The home owners win but the holder of the loan loses. If this were simply an even trade off, it wouldn’t be so bad. Unfortunately there is real work involved and someone has to pay for that work. Someone has to oversee and approve the refinancing of the debt. The payments must be handled and the forms signed. Labor has a real price and it must be baked into the MBS in one manner or another. If refinancing was severely reduced I would believe it would be extremely favorable for mREITs. Spreads Many mREITs had a terrible second quarter in large part due to MBS rates increasing more than interest swap rates. When the MBS rates are increasing the mREIT has a loss on the value of their assets. When the swap rates increase the mREIT records a gain on their derivative that helps to offset the loss on the value of the assets. When the MBS rates are increasing more than the swap rates the result is that many mREITs will record substantial losses in book value. When these spreads widen the mREITs report a loss in book value. Are Wider Spreads Worse? If a widening of the spreads creates a loss of book value, does that make wider spreads worse? Imagine yourself contemplating launching your own one man (or woman) mREIT. You’re contemplating investing in MBS that yield 3.5% and financing it with short-term debt. However, you don’t want the interest rate risk so you could use an interest rate swap to receive the short-term rate and pay a medium-term rate. You would receive the yield on the MBS, pay the short-term rate on your financing, receive the short-term rate from your swap, and pay the medium-term rate on the swap. The two middle steps are effectively canceling each other out so that you would expect to receive the MBS yield and pay the swap rate. If the asset yields 3.5%, would you rather pay 1%, 2%, or 3% on the swap? Hopefully in this scenario you can recognize that you want to pay the lowest rate possible, so 1% would easily be the winner in this scenario. Unfortunately, I’ve met many investors in mREITs that do not understand this mechanism. They become so caught up in the complexities that they miss out on the simple parts of the bigger picture. When spreads were widening during the second quarter it meant that asset yields went up by more than the swap rates. Since the mREITs were already locked into swap rates and MBS assets they were reporting a loss on book value. However, if you wanted to invest a new dollar into this activity it would have been more favorable to do it at the end of the second quarter than at the end of the first quarter. Conclusions The mREIT sector deserves a smaller discount to book value at the end of the second quarter than at the start of the first quarter. The mREITs lost book value from widening spreads, but the wider spreads provide the room for better levels of interest income. If spreads widened again it would mean more book value losses, but I would be willing to pay a value closer to book value when buying mREITs. If refinancing was curtailed, I would expect lower levels of prepayments, lower amortization charges, and consequently better yields on MBS assets. A smaller discount to book value at the end of Q2 does not mean a higher price because the book value we are discounting from is also lower. In my opinion, the sector had good reason to fall after getting hammered by prepayments however the fall was more substantial than I would have considered reasonable. When book value falls on spreads becoming wider and the discount to book value increases at the same time, I see a market failure that makes the mREITs more attractive. I recently added to my position in Dynex Capital (NYSE: DX ) because I felt the discount to book value given the movements in rates was not warranted. Disclosure: I am/we are long DX. (More…) I wrote this article myself, and it expresses my own opinions. I am not receiving compensation for it (other than from Seeking Alpha). I have no business relationship with any company whose stock is mentioned in this article. Additional disclosure: Information in this article represents the opinion of the analyst. All statements are represented as opinions, rather than facts, and should not be construed as advice to buy or sell a security. Ratings of “outperform” and “underperform” reflect the analyst’s estimation of a divergence between the market value for a security and the price that would be appropriate given the potential for risks and returns relative to other securities. The analyst does not know your particular objectives for returns or constraints upon investing. All investors are encouraged to do their own research before making any investment decision. Information is regularly obtained from Yahoo Finance, Google Finance, and SEC Database. If Yahoo, Google, or the SEC database contained faulty or old information it could be incorporated into my analysis.