Tag Archives: risk

Virtus Global Multi-Sector Income Fund: Desperate For Attention?

VGI is pretty much a go-anywhere bond fund. It’s focus is income and it uses leverage and options to get there. It’s relatively young, but so far I’m not overly impressed. I recently wrote about some closed-end funds, or CEFs, that invest in bonds. It’s not a topic I write about often because interest rates are near historic lows, which makes me worried about long-term capital risk here. However, a reader asked me to take a look at the Virtus Global Multi-Sector Income Fund (NYSE: VGI ), so I did. So far, I’m not overly impressed by this young fund. Too young to tell? To start off, it’s important to note that VGI is a young fund. It came public in early 2012 , meaning it doesn’t have a whole lot of history go off of. It also means VGI hasn’t really had to face too much adversity in its approximately three year life. So there’s a notable risk here that management fails to navigate the next big downturn well. For truly risk averse investors, that should be enough to lead you to examine a fund with a longer operating history. More aggressive investors, however, read on. VGI is pretty much a go anywhere bond fund. It’s prospectus gives it the leeway to invest in any country and pretty much any type of bond. The only notable mandate is that at least 40% of assets will normally be invested outside the U.S. market, with a maximum of 75%. After that, anything is fair game while the fund seeks to, “…maximize current income while preserving capital…” That said, the fund has a value orientation, looking to find opportunities in the, “…undervalued sectors of the global bond markets.” Good-old, hands-on credit research is the approach taken. Though VGI notes that sector rotation is a key part of its approach, so the makeup of the fund at any given moment likely won’t be indicative of the fund’s long-term approach to investing. The fund also uses leverage to enhance returns (to the tune of around 30% at the start of the year) and in mid-2014 it also initiated an option strategy. So VGI is far from a low risk offering. The question, then, is whether or not this CEF is worth the risk? I’m not convinced it is. How’s it done? Over the trailing three year period through May, VGI’s net asset value, or NAV, total return, which includes the reinvestment of distributions, was roughly 9%. That’s pretty good when compared to the Fidelity Global Bond Fund’s (MUTF: FGBFX ) loss of roughly 0.5% over the same span. And while VGI’s standard deviation, a measure of volatility, was 7 compared to FGBFX’s standard deviation of roughly 4.5, it was able to make money where a more conservative offering didn’t. VGI’s return was also more than double Morningstar’s World Bond benchmark over that span. So, performance wise, the fund has done well, including over shorter periods. That, of course, has come with increased volatility. But there’s a fly in the ointment here, the fund IPOed with an NAV of $19.10 a share. The NAV is more recently in the $18 a share range. So far, anyway, dividends look like they are doing more damage than good. And that fact makes it all the more interesting that the fund increased its distribution by 20% earlier in the year . According to the news release: “The fund is undertaking these actions to enhance shareholder value by both providing a more attractive distribution rate and furthering its efforts to reduce the current discount to which its shares trade relative to their net asset value (“NAV”).” In other words, VGI is looking to entice investors with a high yield. Which helps explain why the yield is nearly 12% of late. The discount, which started the year at around 10.5% narrowed briefly after the distribution news. However, it’s back to 11% again. The average discount over the trailing three years is around 8%, but that’s distorted by the premium at which all CEFs IPO. So based on total return, VGI is doing well. However, it’s effectively self liquidating right now. And it’s doing it purposefully to attract attention. That’s not a good story, in my book. And, worse, VGI also comes with notable costs, with the expense ratio at around 2.1% in each year of its existence. Although debt costs are a part of that, it’s still an expensive fee to pay for a fund that appears to be slowly liquidating. I’d wait At the end of the day, I think Virtus Global Multi-Sector Income Fund still needs to prove itself. For an aggressive investor it might be an interesting way to add flexibility to a more conservative portfolio if you use it in small doses. But for most others, this one is probably not worth the risk at this point in its life. Disclosure: I/we have no positions in any stocks mentioned, and no plans to initiate any positions within the next 72 hours. (More…) I wrote this article myself, and it expresses my own opinions. I am not receiving compensation for it (other than from Seeking Alpha). I have no business relationship with any company whose stock is mentioned in this article.
Price Stability In An ETF: The Appeal Of Guggenheim Defensive Equity

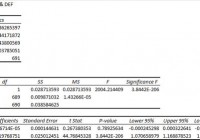
Summary I’m taking a look at DEF as a candidate for inclusion in my ETF portfolio. The only weakness I see is that the ETF has a higher expense ratio as it turns over assets more frequently than I would want. The correlation and standard deviation is very attractive. The data is based on solid liquidity, so feel it is fairly reliable. I’m keeping DEF in the running for my entire portfolio due to the price stability of the ETF. Investors should be seeking to improve their risk adjusted returns. I’m a big fan of using ETFs to achieve the risk adjusted returns relative to the portfolios that a normal investor can generate for themselves after trading costs. I’m working on building a new portfolio and I’m going to be analyzing several of the ETFs that I am considering for my personal portfolio. One of the funds that I’m considering is the Guggenheim Defensive Equity ETF (NYSEARCA: DEF ). I’ll be performing a substantial portion of my analysis along the lines of modern portfolio theory, so my goal is to find ways to minimize costs while achieving diversification to reduce my risk level. What does DEF do? DEF attempts to track the total return (before fees and expenses) of the Sabrient Defensive Equity Index. At least 90% of the assets are invested in funds included in this index. DEF falls under the category of “Large value”. Does DEF provide diversification benefits to a portfolio? Each investor may hold a different portfolio, but I use the SPDR S&P 500 Trust ETF (NYSEARCA: SPY ) as the basis for my analysis. I believe SPY, or another large cap U.S. fund with similar properties, represents the reasonable first step for many investors designing an ETF portfolio. Therefore, I start my diversification analysis by seeing how it works with SPY. I start with an ANOVA table: (click to enlarge) The correlation is 86%. That is a reasonable correlation level under Modern Portfolio Theory. Lower levels of correlation allow more of the risk associated with individual investments to be effectively diversified away. For an ETF that will hold several large U.S. equity securities, that’s a very appealing level of correlation as long as the liquidity is good. Standard deviation of daily returns (dividend adjusted, measured since April 2012) The standard deviation is amazing. For DEF it is .576%. For SPY, it is 0.748% for the same period. SPY usually beats other ETFs in this regard. Because the standard deviation is fairly low and the correlation is pretty good, I’m expecting to see substantial diversification benefits that would make DEF a reasonable fit in most portfolios. Liquidity is moderate Over my sample period the average trading volume was around 35,000 shares per day. Over the last ten days it was over 55,000. Mixing it with SPY I also run comparisons on the standard deviation of daily returns for the portfolio assuming that the portfolio is combined with the S&P 500. For research, I assume daily rebalancing because it dramatically simplifies the math. With a 50/50 weighting in a portfolio holding only SPY and DEF, the standard deviation of daily returns across the entire portfolio is 0.639%. Notice that this is significantly lower than SPY alone. With 80% in SPY and 20% in DEF, the standard deviation of the portfolio would have been .700%. If an investor wanted to use DEF as a supplement to their portfolio, the standard deviation across the portfolio with 95% in SPY and 5% in DEF would have been .735%. Why I use standard deviation of daily returns I don’t believe historical returns have predictive power for future returns, but I do believe historical values for standard deviations of returns relative to other ETFs have some predictive power on future risks and correlations. Yield & Taxes The distribution yield is 2.5%. It’s a reasonable yield for an investor trying to avoid excessive trading costs. A decent distribution yield can help investors avoid feeling a need to open their portfolio up too frequently. Expense Ratio The ETF is posting .66% for a net expense ratio. I want diversification, I want stability, and I don’t want to pay for them. I view expense ratios as a very important part of the long term return picture because I want to hold the ETF for a time period measured in decades. I’m not thrilled with the expense ratio, but it can be tricky to find ETFs with such a low standard deviation of returns and moderate correlation. Market to NAV The ETF is at a .02% premium to NAV currently. Premiums or discounts to NAV can change very quickly so investors should check prior to putting in an order. The ETF is large enough and liquid enough that I would expect the ETF to stay fairly close to NAV. Generally, I don’t trust deviations from NAV and I will have a strong resistance to paying a premium to NAV to enter into a position. I wouldn’t worry about .02%. Largest Holdings The diversification within the ETF may be a substantial part of the lower standard deviation. (click to enlarge) Conclusion This ETF looks like a contender. In the interest of reducing the deviation of returns I find defensive funds appealing as part of a diversified portfolio. The correlation at 86% isn’t too bad and the fund still showed decent returns and holds some of the same companies as SPY while being less volatile. There are some clear diversification benefits here. If an investor was going to hold only SPY or DEF over the next 20 years, I’d expect SPY to end higher. However, the appealing aspect of DEF is that it can reduce the risk of the portfolio. In the context of a more complicated portfolio that is being rebalanced and contains some more volatile ETFs, I like the role of DEF. The average liquidity isn’t too bad. The days with no change in dividend adjusted close is high enough to give me a little concern (18), but there were no days that actually reported 0 trading volumes. Therefore, I think the liquidity is fairly decent and I wouldn’t treat it as a major concern. Having a decent distribution yield doesn’t hurt either in the context of a long term investor. There’s only one area that concerns me. The ETF is posting a fairly high expense ratio relative to the other strong contenders for this space in my portfolio. The portfolio turnover is also very high at 87%. That surprised me a bit. For a defensive ETF, I would expect less shifting in the positions. For comparison, SPY has a turnover ratio of 3%. One strike against the ETF won’t be enough to eliminate it from consideration. I’ll admit that the largest position being Staples makes me scratch my head a little bit, but the position was still under 1.5% so I’d say the diversification is solid and I wouldn’t worry about it. Investors should notice that the ETF does also hold some significant positions in REITs. That doesn’t bother me, but each investor has a different situation. I was expecting to use an ETF dedicated to REITs to increase my exposure in that regard. Disclosure: The author has no positions in any stocks mentioned, and no plans to initiate any positions within the next 72 hours. (More…) The author wrote this article themselves, and it expresses their own opinions. The author is not receiving compensation for it (other than from Seeking Alpha). The author has no business relationship with any company whose stock is mentioned in this article. Additional disclosure: Information in this article represents the opinion of the analyst. All statements are represented as opinions, rather than facts, and should not be construed as advice to buy or sell a security. Ratings of “outperform” and “underperform” reflect the analyst’s estimation of a divergence between the market value for a security and the price that would be appropriate given the potential for risks and returns relative to other securities. The analyst does not know your particular objectives for returns or constraints upon investing. All investors are encouraged to do their own research before making any investment decision. Information is regularly obtained from Yahoo Finance, Google Finance, and SEC Database. If Yahoo, Google, or the SEC database contained faulty or old information it could be incorporated into my analysis. The analyst holds a diversified portfolio including mutual funds or index funds which may include a small long exposure to the stock.

Here Is Why The S&P 500 Should Not Be The Barometer Of Investor Success

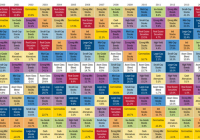
Summary The S&P 500 and the Dow are often quoted on TV and by various media outlets when providing updates on the stock market. By doing this, the media is implicitly suggesting to investors that these indexes represent how the market is actually performing. Trouble is that not everyone has the same definition of “the market” and not every investor has a portfolio that is structured like “the market” – and probably for good. Benchmarks to gauge the performance should be consistent with actual portfolio strategies as opposed to using a widely recognized stock market index, such as the S&P 500 index. Far too often, individual investors measure the success of their investment portfolios, or the effectiveness of their financial advisors, relative to the performance of a well-known stock market index such as the S&P 500 Index (“S&P 500”) or the Dow Jones Industrial Average Index (“Dow”). While it is important for investors to have a tool to measure the success of an investment strategy against, it can be very misleading, and often misguided, if an investor chooses an index as their tool that is not consistent with their risk tolerance or investment objectives. For example, the S&P 500 and the Dow are often quoted on TV and by various media outlets when providing updates on the stock market. By doing this, the media is implicitly suggesting to investors that these indexes represent how the market is actually performing. Trouble is that not everyone has the same definition of “the market” and not every investor has a portfolio that is structured like “the market” – and probably for good reason . In an Investment News article entitled, ” When underperforming the S&P 500 is a good thing ” (sign-up required), author Jeff Benjamin claims that investors have become programmed to dwell on the performance of a few high-profile benchmarks. Benjamin goes on to state that, “…a truly diversified investment portfolio should have returned less than 5% in 2014. It was that kind of year. Any advisor who generated returns close to the S&P was taking on way too much risk, and should probably be fired.” The suggestion of having the financial advisor fired may be extreme, especially if an investor has instructed their advisor to build a portfolio to try and provide performance consistent with, or superior to, the S&P 500 ( or the Dow ) and recognizes the potential risk associated with that type of strategy. However, most investors do not have this large of a risk appetite and appreciate the benefits of diversification to help deal with market volatility if and when it occurs. To this end, many of the growth-oriented investors that we speak with at Hennion & Walsh are interested in portfolios that are managed to help deliver a reasonable return while also providing for some downside protection. As a result, investors generally do not have that large of a percentage of their portfolio assets allocated to the one asset class associated with these two stock market indexes. This asset class is U.S. Large Cap. To this end, Michael Baker of Vertex Capital Advisors stated in the same previously mentioned article that, “The S&P 500 really just represents one asset class – large cap stocks…and most investors only have about 15% allocated to large cap stocks.” Having all of their investment portfolios allocated to one single asset class, such as U.S. large cap, would have rewarded investors well since the last major market crash hit bottom in March of 2009. However, this does not mean that this will always be the case going forward nor has it been the case historically. The chart below from First Clearing shows the annual returns of several asset classes from 2000 to 2014. A quick review of this chart will show how well U.S. large cap stocks have performed since 2009. Since the media focuses on U.S. large cap indexes, investors have thus been constantly reminded of how well “the market,” or more specifically U.S. large cap stocks, has done for the past 5 years. By further reviewing this chart, however, investors are also reminded that this is not always the case. U.S. large cap stocks suffered significant losses in 2008 and 2002 and additional losses in 2000 and 2001. Additionally, while large cap stocks finished in the top half of asset class performance in each of the past four years, they have only achieved this ranking once over the eleven years prior to 2011. Asset Class Returns (2000 – 2014) (click to enlarge) Source: First Clearing, LLC, 2015. Asset allocation cannot eliminate the risk of fluctuating prices and uncertain returns. Past performance is not indicative of future results. This chart is provided for illustrative purposes only and is not indicative of any specific investment. Asset class performance data based on representative indexes. You cannot invest directly in an index. Individual investment results will vary. The data assumes the reinvestment of all income and dividends and does not account for taxes and transaction costs. On the other hand, this chart attempts to illustrate the value of asset allocation with the asset class box named “Asset Class Blend” which is simply an equal weighting of all of the asset class indexes included on the chart. While I am not suggesting that such a blend is appropriate for all investors or all market environments and would likely include more asset classes and sectors to make the chart more comprehensive, the results shown in this chart still certainly demonstrate the potential benefits of diversification in down and/or volatile markets. Not inclusive of the potential fees for the implementation of each respective strategy or associated tax implications, $1,000,000 invested in large cap stocks in 2000 would have been worth $1,866,218 at the end of 2014. Conversely, the same $1,000,000 invested in this particular asset class blend strategy in 2000 would have been worth $2,831,257 at the end of 2014 based upon the annual returns listed in this Asset Class Returns table. $1,000,000 Investment Comparison from 2000 – 2014 (click to enlarge) Data source: Asset Class Returns (2000 – 2014) chart shown above in this post . Chart source: First Clearing, LLC, 2015. Asset allocation cannot eliminate the risk of fluctuating prices and uncertain returns. Past performance is not indicative of future results. This chart is provided for illustrative purposes only and is not indicative of any specific investment. Asset class performance data based on representative indexes. You cannot invest directly in an index. Individual investment results will vary. The data assumes the reinvestment of all income and dividends and does not account for taxes and transaction costs. As a result, it is imperative that investors are honest with themselves about their true tolerance for risk. If they are truthful to themselves, their risk appetite should not change based upon the current directional performance of “the market.” If an investor is not comfortable assuming the risk of “the market” or a single asset class, such as U.S. large cap, in all market environments, then they should consider the following: 1. Building ( or maintaining ) a diversified portfolio, incorporating a variety of asset classes and sectors, consistent with their tolerance for risk, investment timeframe and financial goals. 2. Utilize a benchmark to gauge the performance of their investment strategy that is consistent with (1) above as opposed to using a widely recognized stock market index, such as the S&P 500, that may not be relevant, and is likely very unhelpful, to them. 3. Try to not make critical portfolio decisions based on short term performance results but rather consider longer term performance results relative to their own overall financial goals. 4. Avoid the temptation of being influenced by media reports on general market performance to measure the success of their own investment portfolios, or the effectiveness of their respective financial advisors. Disclosure: The author has no positions in any stocks mentioned, and no plans to initiate any positions within the next 72 hours. (More…) The author wrote this article themselves, and it expresses their own opinions. The author is not receiving compensation for it. The author has no business relationship with any company whose stock is mentioned in this article.