Tag Archives: real estate
Electric Transmission In Transition – Sheltering $1 Billion A Year In Potential Future ROE
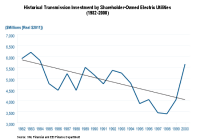
With an average FERC base-rate ROE of 10%, electric transmission firms could earn $1 billion a year in allowed returns from investments made 2014-2017. Last fall, the IRS ruled transmission firms could quality as a REIT structure. REIT structures could entice large utility firms to spin-off their transmission business. The electric transmission business may be starting to tiptoe into a vast sea of change. With the exception of ITC Holdings (NYSE: ITC ), the majority of transmission assets are held within much larger diversified electric utilities. For example, American Electric Power (NYSE: AEP ) owns the largest transmission network in the US with about 32,000 miles of line. First Energy (NYSE: FE ) is not far behind with 24,000 miles. Other major utilities with substantial transmission assets are: Southern Company (NYSE: SO ), Duke Energy (NYSE: DUK ), PG&E (NYSE: PCG ) and Edison International (NYSE: EIX ). Pacific Corp is building 4,300 miles of new lines and Xcel (NYSE: XEL ) has 3,300 miles of projects on the books. AEP is building 27 projects consisting of 3,200 miles of lines in partnership with others. Combined, AEP’s projects total $9 billion. The partnership of Duke and American Transmission is not far behind with 2,700 miles of additions. American Transmission is a joint venture of several utilities and municipalities in Wisconsin. Even the Oracle of Omaha is collaborating with AEP in a 50-50 partnership to build transmission projects in Texas. It is common knowledge that the grid has suffered from years of neglect and is demonstrated by the graph outlining transmission investments from 1982 to 2000. After hitting bottom at under $3.5 billion, annual investments are stabilizing over the next three years at $20 billion a year. The following graph outlines industry wide investments from 2008 to projected 2017. Source: eei.com (click to enlarge) Source eei.com About 45% of cap ex is dedicated to expansion of the network, and an additional 15% goes for replacement due to age, obsolescence, and storm damage. Between 2014 and 2017, there are expected to be 22,800 additional miles of transmission lines in the US. The balance of investments is grid network improvements such as fundamental, advanced technologies, and enhanced security. Projected Transmission Capital Expenditures by Type of Activity Years 2014 to 2017 Source eei.com Transmission investments industry-wide are expected to total $78 billion between 2014 and 2017. If 50% if this investment is considered equity and the FERC-allowed average ROE is 10%, the total industry-wide allowed return could translate to an additional $1 billion a year from investments made from 2014 to 2017. Historically, FERC regulated assets are more profitable than state regulated assets. For example, prior to FERC’s recent ruling in New England, ITC could earn between 12% and 13% return on equity vs. the most recent state average allowed return of just under 10%. Below is a chart from eei.com (pdf) outlining the average state regulated rates going back to 1990. The chart is from their quarterly report “Rate Case Summary” Source eei.com The FERC is under pressure to reevaluate its rate structure in some regions in the country. For example in the Northeast, the FERC settled a complaint by reducing the allowed return on transmission assets. Consumer advocates are pushing the New England rate structure as a nationwide model. In a press release , last year, the FERC announced a new maximum allowed base ROE of 10.57% for assets in the New England region, and was a reduction from the previous rate. In addition, there are several incentive clauses that could increase the base rate, such as a 0.5% incentive for stand-alone, independent companies. Currently ITC is the only publicly traded utility that qualifies for this incentive. More information on ITC can be found in a SA review from last May here and more information on the transmission business from the Edison Electric Institute here . But that may soon change. The dawn of utility asset financial engineering is upon us. The spin offs of natural gas pipelines and mid-stream assets into limited partnerships, along with the recent separation of NRG’s generation into NRG Yield (NYSE: NYLD ), foretells of structural changes within the transmission sector. Last fall, the IRS ruled that entities such as electric transmission assets could quality for a REIT structure. From a Moody’s article last Oct: Large US power transmission utilities are actively exploring the feasibility of using the real estate investment trust structure as a financing vehicle, says Moody’s Investors Service. It is plausible that utility REITs might emerge as early as late next year (2015). “Many US utilities are taking a look at their transmission assets to assess whether utilizing a REIT structure makes sense, given the abundance of these types of assets that produce steady cash flows,” says Moody’s Associate Managing Director Jim Hempstead in the report “US Utility Transmission Assets: Power Transmission REITs Poised to be Sector’s Next Phase of Financial Engineering.” Utilities have been pursuing “financial engineering” structures because yield-hungry investors assign premium valuations to vehicles with steady dividend growth trajectories, says Moody’s. From an article on publicpower.org explaining the IRS ruling and reporting on Moody’s report: In 2014, the Internal Revenue Service clarified existing rules that define what constitutes real estate. As a result, the REIT sector has grown as companies look to spin off their assets into new companies that are effectively exempted from corporate taxes as long as they operate within REIT guidelines. The 2014 IRS clarifications have helped open the REIT structure to non-traditional sectors, such as electric transmission in the case of utility companies; or fiber optic and copper networks, in the case of telecommunications companies. Potential REIT candidates in the utility sector include Texas-based transmission and distribution utilities and large transmission-only companies. Transmission assets make for an alluring REIT because they provide steady income that allows for dividends, a key feature for REIT investors. Utilities that create REITs out of their transmission assets are separating a yield asset from their growth assets, Moody’s said. “Regulatory contentiousness risk might increase because customer groups will object to future rate requests more aggressively,” the report said. “Other regulatory considerations that are likely to become more active include discussions over the appropriate cost of capital, the authorized return on equity and cost allocations.” Moody’s still sees ITC’s FERC-regulated transmission assets as a candidate for becoming a REIT. It also sees American Electric Power Co. Inc., FirstEnergy Corp., Xcel Energy Inc. and Entergy Corp., all companies that Moody’s said make transmission a core strategy, as likely candidates. Electric utility investors should be aware that a change in corporate structure also brings with it a potential credit downgrade as a higher portion of operating cash flow moves on to shareholders. Much like the REIT conversion craze that started in the timber industry in the last 1980s and leading to culmination of most timber companies now structured as REITs, the attraction of financial engineering transmission assets could be too tempting to avoid. All it will take is one to lead the way. ITC would be the most logical choice as it is already an independent firm. I expect larger utilities will then be under greater pressure to spin off their transmission businesses also as REITs. However, the impact of distributing greater portions of operating cash flow to shareholders to satisfy the REIT regulations, rather than reinvesting it as equity in additional growth projects, needs to be evaluated. Moody’s believes this will become a prominent topic of utility conversation by the end of this year. If they are correct, a new REIT sector will be born, offering the advantages of high shareholder distributions supported by federally regulated assets, which are more profitably than similar state-regulated investments. Author’s Note: Please review disclosure in Author’s profile. Disclosure: The author is long ITC, SO, AEP. (More…) The author wrote this article themselves, and it expresses their own opinions. The author is not receiving compensation for it (other than from Seeking Alpha). The author has no business relationship with any company whose stock is mentioned in this article.
Time To Bet Against Japan?
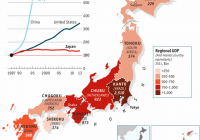
Summary Japan is struggling with economic decline, debt, and demographics. Abenomics has yet to show promised and needed progress. We see opportunity investing in a rising Dollar against a falling Yen. Global Context The world is presently full of economic and financial concern. Central banks in nations around the globe are trying to work their magic in order to increase economic growth and financial returns. A primary method of choice is currency devaluation. This simply means that countries are creating more currency with the goal of watering down its value. When this happens, it is easier to stimulate the economy and to sell and export goods and services to other countries. Why is that? Because your goods and services in your weakening currency are now cheaper for outsiders to buy in their stronger currency. The problem is that other countries also want to sell and export their goods. This is how we end up in what is known as a “currency war.” This means countries are fighting to have the weakest currency to boost exports and economic growth. We have seen this actively done in the U.S., Japan, China, and now Europe. Those also happen to be the four major economies in the world. In spite of the efforts of the U.S. Federal Reserve, the U.S. Dollar has been gaining strength since July 2014; gaining around 17% in that time frame. In contrast, since the beginning of 2013, the Japanese Yen has lost nearly 50% of its value compared to the U.S. Dollar. Since May of 2014, the Euro has lost around 18% of its value compared to the U.S. Dollar. Japan’s Three Struggles All of this information begs the question, is there still an opportunity to make money on these trends? We have been watching the falling value of the Euro and the Yen for a few months now. As we have waited, it appears we missed a pretty great opportunity to buy put options on the Euro via the CurrencyShares Euro Trust (NYSEARCA: FXE ). Unfortunately, that is the reality of investing sometimes. While there is still the potential for further downside in the Euro, the trade carries more uncertainty than when FXE was sitting around $125 as opposed to around $115 now. Unless someone expects the Euro to collapse or fail, shorting FXE has less certainty from here. What about the Yen and a short position on the CurrencyShares Japanese Yen Trust (NYSEARCA: FXY )? Japan currently faces three major problems: economic growth, debt, and demographics. Economic Growth (click to enlarge) As you can see from the chart, Japan has experienced either flat or negative economic growth over the last 25 years. Even so, it is still the third largest economy in the world behind the U.S. and China. After these “lost decades,” in hopes of reviving the economy, the Japanese people elected Shinzo Abe. Abe campaigned on the premise that he would enact a bold three-part plan of stimulus spending, monetary easing, and structural reforms that would turn things around. Together these are known as the “three arrows” of “Abenomics.” Debt So far, Abenomics has done much to boost the Japanese stock market, but little to boost the overall economy. In the process, Japanese debt has soared to nearly 250% of GDP, the highest debt to GDP ratio in the world. (click to enlarge) As spending and debt grow, the theory has been that taxes would also increase to help balance the equation. One tax increase has gone into effect, but future increases have been postponed because of economic weakness. To further complicate the issue, Japan is facing a losing battle of demographics. Demographics (click to enlarge) The population of Japan is shrinking, rather quickly. The current population of 127 million is expected to fall to 100 million by 2050. This means less people to work to provide economic growth and to pay taxes, and more elderly people dependent on government healthcare. In summary, Japan has a shrinking economy, shrinking population, and ballooning debt. That all sounds pretty bleak, but none of this is entirely new information. People have written of gloom for Japan for years, expecting decline and even collapse as the Japanese economy has marched on free of catastrophe. Japanese Desperation So, what makes this time potentially different? Two primary factors: By electing Abe the Japanese people have shown they are ready for change, even if it means drastic measures. Japan is no longer alone. Europe, China, and the U.S. are also fighting something between economic stagnation (U.S., China) and outright decline (Euro). Re-Election of Abe By electing and re-electing Abe, the Japanese people appear ready to do whatever is necessary to revive their economy. So far, their efforts have lead to a 50% decrease in the value of the Yen compared to the U.S. Dollar and there has been little to show for it on the economic front. Abe and Bank of Japan governor, Haruhiko Kuroda have made the eradication of deflation their chief gauge of success. They have concluded that inflation of 2% is what is needed to jump start Japan out of deflation. What is one of the prime means of fighting deflation? Boosting inflation. Creating more currency and thereby devaluing the Yen is among the preferred methods for creating inflation. Currency War To add even more challenge to Japan’s situation, they are now competing with other major economies to devalue their currencies in an attempt to stimulate growth and exports. This presents a scenario of competing desperation, commonly referred to as a currency war. So far, Abe has been true to his word with the first two arrows of Abenomics, but the third arrow of structural reform seems to still be in question. Corporate tax cuts are the latest announced move to help bring about the structural reform promised in the third arrow. Shooting Blanks not Arrows None of these measures can compensate for the major demographic problem that Japan is facing. How can an economy continue to grow when the population is shrinking? How can a shrinking population manage a ballooning debt that is already the largest in the world? Japan is in a desperate place, and the Japanese people have finally acknowledged it through their election and re-election of Abe. The primary methods of developed economies to stimulate growth have been stimulus spending and monetary easing. It seems to be a reasonable conclusion that a desperate Abe, with the backing of the Bank of Japan and the Japanese people, will only add more fuel to the fire in order to heat up their frozen economy. This means that the value of the Yen is very likely to continue to fall, particularly in relation to the strengthening U.S. Dollar. In addition, there is the possibility of an outright monetary or financial collapse in Japan. For the sake of the Japanese people, we hope it doesn’t come to that. As investors, it would be wise to consider and prepare for the possibility. Potential Opportunity How can investors respond to a declining Yen and a strengthening U.S. Dollar? We have chosen to invest simultaneously in the strengthening U.S. Dollar and a weakening Yen by buying put options on the CurrencyShares Japanese Yen Trust. One writer has put a target of around $70 on FXY by year-end; roughly a 15% drop from when I began writing this article. That level of decline could offer a nice gain and the potential of a significant one if the Yen experiences a major loss of confidence. Conversely, the likelihood of the Yen gaining much on the U.S. Dollar seems pretty low. That makes for a relatively low risk investment that offers a potentially high reward. Let us know if we have missed anything or if you have any questions. Note: All charts are from The Economist, 12/15/14, ” Japan in Graphics: Falling Blossom “. Disclaimer : This article is for information purposes only. There are risks involved with investing including loss of principal. All readers must be responsible for and make their own investing decisions. Each reader bears the full responsibility for any decision to buy, sell, or hold any securities, precious metals, real estate, or other asset class as well as any decision regarding the starting or running of a business. Nothing in this newsletter is to be considered investment advice, a formal recommendation, or solicitation to buy or sell any security. Investor in the Family LLC makes no explicit or implicit guarantee with respect to performance or the outcome of any investment or projections made. There is no guarantee that the goals of the strategies discussed by Investor in the Family LLC will be met. Investor in the Family LLC may receive payment for promoting some products found in this article. Even so, Investor in the Family LLC aims to promote products that it has tested and believes will add value to readers. Please see full Disclaimer . Disclosure: The author is long JAN 16 FXY PUTS. (More…) The author wrote this article themselves, and it expresses their own opinions. The author is not receiving compensation for it. The author has no business relationship with any company whose stock is mentioned in this article.