Tag Archives: premium-authors

Low P/E Stock Of The Day No. 5: Calpine Corporation

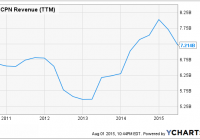
Summary The company is trading at TTM P/E of 8.8x. Environmentally operations mean that the company will face less regulatory issues. Increase in EPS is the result of favorable macro-conditions, increasing the Commodity Margin. In this series I will select a low P/E stock to analyze. I define low P/E as anywhere from 5x to 10x, as any lower and we may be looking at special situations. Calpine Corporation (NYSE: CPN ) is a U.S. power producer. The company primarily operates natural gas-fired and geothermal power plants and sells wholesale energy to corporate customers. Natural gas-fired generators use gas as fuel to power turbines while geothermal powered generators harness energy from hot water below Earth’s surface. At the end of 2014, the company had 88 plants in total. After beating its second quarter earnings, share shot up 10%. But the company is still trading at a TTM P/E ratio of 8.8x, well within our selection criteria. Let’s explore further and see if there may be an opportunity. The Business While the company generates power from renewable sources (geothermal) as well as fossil fuel (natural gas), the two methods share the common characteristic of being environmentally friendly. How geothermal energy is good for the environment is self-explanatory, but it may surprise you that natural gas is actually one of the cleanest fossil fuel options for electricity generation, emissions are virtually zero. Why is this important? In an increasingly stringent regulatory environment, non-environmentally friendly power generating methods (e.g. coal) are facing some tough challenges . This means that Calpine will not face similar legal issues in the future, decreasing the risk for shareholders. Making Sense Of The Numbers As evident by the above chart, revenue has been increasing since FYE 2012. However, this is not attributed to a larger turnover (i.e. electricity generation), as power generated did not vary much from year to year. The company generated 112 MMWh of power in 2012, 102 MMWh in 2013, and 100 MMWh in 2014. As you can see, the amount of power generated actually decreased, yet revenue still went up. This is possible because the price that the company gets per MWh fluctuates. This is called the Commodity Margin and it is impacted by a plethora of factors such as price of natural gas, economic growth, and environmental regulation. In a sense, this risk can be compared to the commodity risk faced by all energy producing companies. For the last couple of years, the company has benefited from favorable macro-factors (e.g. falling natural gas prices) that allowed it to increase its Commodity Margin. What does this mean? This means that earnings can be quite volatile. From the chart below we can see that both the operating margin and the EPS swings wildly from year to year. Conclusion The company does not face imminent challenges from regulators and should be around for a long time, but its financial results do not share the same outlook. The surge in EPS that the company experienced over the past couple of years can be largely attributed to extrinsic factors. This is the risk that you must be willing to bear if you want to invest in a wholesale power company. While favorable macro-environment factors will benefit the company (as they have done so for the past three years), the company cannot generate predictable earnings in the future, meaning that the low P/E ratio today does not necessarily translate to a cheap stock. Disclosure: I/we have no positions in any stocks mentioned, and no plans to initiate any positions within the next 72 hours. (More…) I wrote this article myself, and it expresses my own opinions. I am not receiving compensation for it (other than from Seeking Alpha). I have no business relationship with any company whose stock is mentioned in this article.

Trading Against Your Bias: How And Why

I initiated a short in crude oil back in July, and an astute reader sent me a good question. For many weeks/months, I had been operating with the assumption that crude oil was probably putting in a long-term bottom based on the action back in March/April of 2015; his question was how and why did I take a short against that bias. It’s a good and instructive question, so I thought I’d share the answer with you here. One of the advantages of writing about financial markets and publishing that work every day is that I have a record of what I was thinking and saying at any point in time. As I’ve written many times, I think journaling is one of the key skills of professional trading – this is a form of that. Let me set the background with some charts from a few months ago. A good place to start is in the aftermath of the 2014-2015 sell-off in crude oil. The market bounced in February 2015, set up another short attempt that more or less ran out of steam around the previous lows, and then rallied strongly off those March lows. In early April, I began to work with the idea that crude may have just put in a bottom. A chart says it better: (click to enlarge) Back in April, the case for a bottom in crude oil. Over the next few months, this thesis appeared to be playing out, but it’s important to remember that a bottom is a process. We don’t (usually) identify the absolute extreme of a move and then expect the market never to return. No, it’s far more likely that the market will go flat a while (check), and perhaps even re-test the previous extreme. This is normal, and it may even be those retests that really hammer the bottom in place. It’s easy to imagine hordes of traders thinking that crude oil is going to $20, entering short on a breakdown, and then watching in dismay as the market explodes to new highs after barely taking out the previous lows. A market will do whatever it can, at any time, to hurt the largest number of traders This, in fact, is nearly a principle of market behavior: A market will do whatever it can, at any time, to hurt the largest number of traders. That’s not just cynicism, I think it’s a legitimate consequence of the true nature of the market . Now, we certainly don’t want to be one of those gullible traders who gets tricked into shorting at exactly the wrong time, do we? So what do we do when the market gives us a nice, fat pitch right over the center of the plate, like this? A nice setup for a short, but what about the higher time frame conflict? And just to complete (or, perhaps, to further complicate) the picture, here’s the weekly chart from the same day: Thoughts on that higher time frame. So, just to clarify the situation here, in some bullet points, are the most important elements of market structure at the time we might have been thinking about a short entry: Within the past year, this market had a historic decline. Many people are inclined to think “Too far, too fast,” and that the move will reverse. On the other hand, maybe something fundamentally has changed. At the very least, we need to be aware that these might not be “normal” market conditions. After that historic decline, oil put in what looked like the first part of a bottom: A retest of lows, strong upside momentum off those lows, and then, daily consolidation patterns breaking to the upside. Following that step, the market went flat and dull, perhaps setting up a breakout trade. That breakout was to the downside, and a clear daily bear flag formed after the breakdown. Taking a short could mean going against the longer-term bottom (if it is forming), so what do we do? Many traders end up paralyzed with multiple time frames, as it’s easy to get overwhelmed with information. This is obviously a mistake, but there are also gurus who oversimplify the subject, saying, for instance, to only take a trade when it lines up with the higher-time frame trend. Though this idea is elegant and appealing, it falls short on several counts. For one, the best trades often come at turns, and if you wait to see an established trend, you’ll miss those trades; and even more importantly, the moving average-based trend indicators people use do not work like they think. (In fact, when a moving average trend indicator tells you a market is in an uptrend, at least for stocks, the stock is more likely go down !) Managing the conflicts How do we resolve all of this? I think this is a question that every trader must answer as part of his or her own trading plan. The one thing you probably cannot do is take each case as a new thing and try to make up rules for each situation. It’s far better to have a plan, and to then to follow that plan with discipline. For me, the answer is that a trade is just a trade. I have never been able to prove that having multiple time frames aligned actually increases the probability of those trades. (Though, those examples do sell books!) The way I think about it, if I have a higher-time frame trade that points up and a lower-time frame trade that points down, one of those trades will likely fail. I don’t know which, and I can’t know which in advance. If I knew the higher-time frame trend was more likely to work, I’d just trade that one, but in all intellectual honesty, I don’t know that. No one does. It’s possible that higher-time frame trend will fail because of the meltdown on the lower time frame, and if I’m positioned with that lower time frame, then I will be happy. It’s also possible I will get my first profit target even if the higher-time frame pattern “wins”, so I may be able to make money on both sides of the trade. Perhaps I want to skip the lower-time frame trade and just look for a higher-time frame trade around the previous low – that’s also a viable strategy. What matters is that I know what I will do in advance, and that I am honest about the limitations and constraints. We can only work within the laws of probability, and there are certainly limits to what can be known. It’s not a question of my competence as a trader, but of molding the methodology to fit the realities of the market. A trade is just a trade – avoid complications, and simplify.