Tag Archives: portfolio

3 Top REIT ETFs Battle It Out, With Some Surprising Results
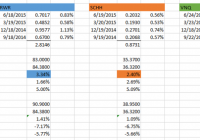
Summary REITs can enhance your core portfolio by helping you diversify into an added asset class. In this article, we will examine three worthy competitors, examining both their similarities and differences. Along the way, the author will have a preconceived notion disturbed, and discover some surprises with respect to recent performance. Now that I have spent a little time covering some basic core ETFs with which to build a simple, though well-diversified, portfolio , I thought I would branch out into an asset class that you may wish to consider as an added component. That asset class is REITS. For a little background on REITS, as well as a link to further reading if desired, feel free to check out this article on my personal blog. Presenting The Competitors In doing some research in preparation for this article, I consistently encountered information featuring three ETFs as preeminent contenders in this space; the Vanguard REIT Index ETF (NYSEARCA: VNQ ), the SPDR Dow Jones REIT ETF (NYSEARCA: RWR ), and the Schwab U.S. REIT ETF (NYSEARCA: SCHH ). I listed them in the order I did based on some commonalities I encountered in my research. VNQ is often described as sort of the pre-eminent player in the field, the “big daddy” if you will. With an inception date of 9/23/04, 145 REITs in the portfolio, $23.7 billion in Assets Under Management (AUM) , a low .12% expense ratio, and great daily trading volume leading to a wonderful average price spread of .01%, there are many reasons this ETF has been described using terms such as “the king” and “top of the charts.” RWR , in contrast, might be termed the “grand old man.” This venerable ETF is the oldest of the three, with an inception date of 4/23/01. RWR features 94 REITs in its portfolio. It has approximately $3.1 billion in AUM , an expense ratio of .25% and an average price spread of .03%. SCHH might be thought of as the “new, but competitive, kid on the block.” With an inception date of 1/13/11, it has only been around a little over 4 years. It features 95 REITs in its portfolio. It is also the smallest of the three, with $1.3 billion in AUM . Due to its smaller size and lower daily volume, it has a price spread of .05%. But here’s the kicker. Though it tracks the same index as RWR, it does so with an incredibly low .07% expense ratio. That’s right, not only does it handily beat out RWR in this area, but it also beats the much larger VNQ! Similarities and Differences As you might quickly gather, VNQ is the obvious winner in terms of greatest diversification. VNQ tracks the MCSI US Reit Index , which contains 144 constituents, whereas both RWR and SCHH track the Dow Jones U.S. Select REIT Index , which contains 92 constituents. One similarity is that the Top-10 holdings are almost exactly the same in all 3 ETFs; with General Growth Properties (NYSE: GGP ) just slipping out of the 10th spot in VNQ, replaced by Vornado Realty (NYSE: VNO ). However, here are two data points that highlight VNQ’s greater diversification. Simon Property Group (NYSE: SPG ) is the top-weighted holding in each ETF. However, while it comprises 9.83% of both RWR and SCHH, it only comprises 8.39% of VNQ. Clearly, how SPG performs will have a greater effect on RWR and SCHH. As of the latest published data, the total weight of the Top-10 holdings in RWR and SCHH is 44.63% and 44.61%, respectively. In contrast the total weight of the Top-10 holdings in VNQ is a lower 36.4%. In terms of sectors, all three track fairly closely, with a slightly higher percentage of residential REITs being featured in RWR and SCHH; approximately 20.2% vs. 17.3% in VNQ. This is offset by a slightly higher weighting in specialized REITs in the index tracked by VNQ. Recent Performance – And A Few Surprises To be honest, I came into this evaluation with somewhat of a preconceived notion. Perhaps you are already sensing it, from what you read above? I sort of felt like VNQ was going to be the runaway winner. I mean, its size, better diversification (including smaller REITs), great expense ratio, what could be better? The fact that I own VNQ in my own portfolio perhaps contributed to my viewpoint (bias?) as well. But then I started to dig into some numbers over the past year. I looked at the dividend distributions for each fund and compared them against the respective share prices. Something interesting leaped out at me right off the bat. Have a look at the picture below: (click to enlarge) First of all, you might note that VNQ (highlighted in green) is the winner as far as dividend distributions over the past year, at 4.08%. “Yep, pretty much confirms that VNQ is the king,” I proudly thought to myself. But then something caught my attention with respect to RWR (in blue) and SCHH (in brown). Both ETFs track the same index, yet RWR returned almost a full percentage point more in dividend distributions! How could that be? I next started wondering how the comparative share prices had performed over that period? In other words, was there a greater increase in the share price of SCHH that would offset the higher dividend paid by RWR? And that’s when the surprises started. Have a look at this 1-year chart: RWR data by YCharts The first item that jumped out at me was that SCHH’s share price had appreciated by 2.69% over that year, compared to 1.66% for RWR. Not only did that offset the larger dividend, in terms of total return it meant that SCHH outperformed RWR, 5.09% to 5.00% (you can see that back on the spreadsheet). That didn’t necessarily surprise me so much, as SCHH carries a lower expense ratio. You’re probably already noticing the second surprise, aren’t you? VNQ’s share price performance substantially trailed the other two; losing .20% over the period. Surely the greater dividend compensated for this? Sorry, it didn’t. To my great surprise, VNQ came in dead last in terms of total return. “Perhaps,” I thought, “this was just an aberration, something about the timing.” So I ran the same chart, but YTD through June 30. Here it is: RWR data by YCharts The first thing you will likely note is that the entire REIT sector took a pretty big hit between approximately February and June. The second thing you might note, though, is that the order of performance is the same. SCHH actually performed the best (in this case, losing the least), followed by RWR, with VNQ once again bringing up the rear. Have another look back at the spreadsheet. Even with its larger Q1 and Q2 distributions, VNQ still trails the pack in total YTD return. OK, last picture, I promise. The REIT sector has actually staged a nice comeback in July, so I thought I would see how this has played out for our 3 competitors: RWR data by YCharts Interestingly, this time the order is precisely reversed. VNQ is the strongest, with RWR in the middle and SCHH bringing up the rear. Summary & Conclusion Along the way, this became quite the interesting exercise for me, and reminded me to take nothing for granted, but instead to dig into the numbers, ask questions about details that did not appear to make sense, and follow the trail wherever it lead. At the end of the day, I’m going to call this one a tie between VNQ and SCHH. Ironically, during this latest downturn, it would appear that the smaller REITs in VNQ’s portfolio actually hurt its performance. Still, I like VNQ’s extra diversification, size and tradeability, low .12% expense ratio, and lengthy track record. At the same time, SCHH is a worthy competitor. Though not having as extensive a track record, it sure appears that Charles Schwab has succeeded in offering a quality, competitive ETF in the REIT space. That low .07% expense ratio is not to be ignored, particularly if one is a long-term investor and the slightly higher price spread is not a concern for you. And, with 95 REITs in the portfolio, it certainly offers solid diversification. RWR comes in last in my view simply because it appears clear that SCHH’s lower expense ratio is giving it a slight edge in performance. Still, if one currently holds RWR, I don’t see any particular need to sell it in favor of either VNQ or SCHH, particularly if this would create a tax impact due to unrealized gains. One last thing, if at all possible it is preferable to hold REITs in tax-deferred accounts. Since REITs receive preferred tax status as entities, their dividends are deemed non-qualified to the investor, meaning they do not benefit from the lower “qualified” dividend tax rate granted to firms that are double-taxed. As an investor, this means that you would pay tax at your highest marginal tax rate . Disclosure: I am/we are long VNQ. (More…) I wrote this article myself, and it expresses my own opinions. I am not receiving compensation for it (other than from Seeking Alpha). I have no business relationship with any company whose stock is mentioned in this article. Additional disclosure: I am not a registered investment advisor or broker/dealer. Readers are advised that the material contained herein should be used solely for informational purposes, and to consult with their personal tax or financial advisors as to its applicability to their circumstances. Investing involves risk, including the loss of principal.
Senior Loan Funds: Buy Inexpensive Defense Against Rising Interest Rates

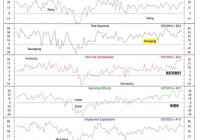
Instability in Greece and China further emphasizes the ‘asynchronous recovery’ where the US might decouple from the reset of the world. In this scenario, investors would want to prepare for mild to moderate increase in US interest rates, and diversify towards rising interest rate assets. Blackstone Strategic Credit (BGB) is one such opportunistic play with a total yield value proposition worth considering. Investing is a confusing thing these days. There’s a pundit for every theory. There’s Jeff Gundlach and Bill Gross talking about the Bond ‘freight train’ and how interest rates are going to rise. There are pundits talking about how Greece and China are going to fall off the cliff (so interest rates fall further), or how secular stagnation is going to be a long-term malaise on the world economy. You can prepare for the two extremes by investing in bonds and commodities, but what about the muddle in the middle? How do you deal with the Asynchronous Global Recovery where the US trends gently higher while the rest of the world grapples with issues that are behind us? This muddle – slow(er) growth than past recoveries but higher interest rates than we have today, is something your portfolio should have an allocation to. This is where Bank Loan (or Senior Loan) funds come in. Bank Loans do better as the economy does better, but in ways that are unique to their asset class. Since they are an out-of-favor asset, buying a closed end fund or CEF gives you the additional pop of a NAV discount that will turn into a NAV premium at a future point. The right CEF thus gives you asset exposure at a discount, and therefore protection on the downside and returns on the upside. US is in (Gentle) Recovery Mode. We could argue endlessly for any of many sides (deflation, recession to be, recovery) based on the indicators we pick, but the hiring and compensation market (see Figure) suggests a gentle recovery to be the most likely possibility. Indirect data suggest that end market conditions that are interpreted as recessionary (e.g. housing starts) are a sign of labor shortage, not low demand. Asset Class Div ersification. The adjoining figure from Credit Suisse shows you the correlations between Bank Loan funds and a number of other common asset classes over the last 20 years. While Bank Loans have had a moderate correlations to High Yield over that period, they provide Asset Class diversification against most of the other traditional asset classes. High Yield has some unique near-term concerns including withdrawal risk (a matter Carl Icahn took a megaphone to in the recent past) and duration exposure, so I believe the current correlation to be notably below the 20 year correlation. Many Choices, Some Better than Others. The adjoining figure provides you a list of options within the Senior Loan CEF category. If you eyeball their charts – you will notice their performance to be highly correlated, and uniformly uninspiring over the last 2 years. But the future isn’t the past. The future is a Wall Street expectation of at least a gentle recovery, global unrest notwithstanding. You would probably do reasonably picking any one of these earning a 6-7% interest while you wait. A number of these funds are trading at a NAV discount of 10-12%, having traded at premiums to NAV in times past. So there is another shared element of the upside. But I favor Blackstone Global Credit (NYSE: BGB ) within the category for a couple of reasons. First, Senior Loans are at the ‘spicy’ end of fixed income, with a risk (and return) that is greater than stodgier asset categories such as Treasuries. I prefer to go with fund managers who have a Private Equity background and do ‘spicy’ as a matter of routine. If there are liquidity issues as Mr. Icahn raises as an issue, Blackstone has successfully navigated rockier waters than most. Second, hedge fund manager SABA Capital (which has a long history of outperforming the indices) took a 5% stake in BGB . BGB is the only Senior Loan Fund on SABA’s portfolio, and is perhaps their testament to the veteran management team in a specialized space. It is worth mentioning that Senior Loan funds are tied to what’s called the LIBOR floor . With rates below the LIBOR floor, interest might not trend upward until interest rates go up 50 to 75 basis points. But with a 6-7% interest and 10% NAV discount, there is a total return thesis that gives you income, NAV return and inflation protection. Disclosure: I am/we are long BGB. (More…) I wrote this article myself, and it expresses my own opinions. I am not receiving compensation for it (other than from Seeking Alpha). I have no business relationship with any company whose stock is mentioned in this article.

The Season For Merger Arbitrage

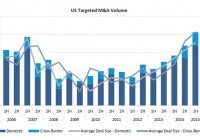
Summary The ongoing boom in M&A activity is creating a more robust opportunity set in merger arbitrage. Importantly, this is occurring at the same time that most other strategies (and general equity market exposure) are becoming increasing overvalued/unattractive. From a risk standpoint, merger arbitrage also appears to be becoming more compelling given its relatively low beta, and the plethora of risks building for general equity market exposure. A Little Background For those new to the strategy, generally when a merger is announced, the stock price of the target immediately jumps toward (but not fully to) the offer price. The remaining gap exists for two primary reasons: 1) there is a possibility (typically small) that the deal could fail to be consummated, and 2) legacy holders of the target’s stock that have typically just experienced a large windfall gain are sometimes willing to forgo the relatively smaller amount of remaining alpha due to their lack of experience in merger arb (and consequent limited ability to underwrite the risks). Merger arbitrage specialists attempt to capture this alpha by buying the target’s stock (and shorting the acquirer’s in cases where part of the consideration offered is stock). They then seek to profit as the spread compresses, with the deal moving to completion. Merger arb is most commonly pursued by hedge funds. However, in recent years ETFs have also emerged to pursue the strategy passively (the largest of which being the IQ Merger Arbitrage ETF (NYSEARCA: MNA )), and there are a handful of Seeking Alpha contributors focusing on it as well. Increasingly Attractive when Other Strategies are Least Attractive Like most strategies, the general attractiveness of merger arb varies over time based on fluctuations in supply (in this case of M&A deal volume) and demand. As mentioned, demand comes mostly from hedge funds and tends to be reasonably sticky, as it takes time for the funds to raise capital from their underlying investors (or for investors to take back capital) based on changes in the attractiveness of the opportunity set. The result is that when there are big changes in deal volume, this supply can temporarily overwhelm (or underwhelm) demand, leading to higher (or lower) risk-adjusted returns. From 2010 through 2013, deal-flow was limited as corporate managements were reluctant to make bold moves toward expansion with fresh memories of the 2008-2009 disaster in mind. As a result, merger arb players struggled to perform, and the HFR merger arb index posted very modest single-digit returns annually. However, since 2014 there has been a substantial pick-up in M&A activity as the financial crisis has fallen farther from mind, many corporate balance sheets have become increasingly bloated with cash, and tightened credit spreads have enabled companies to raise capital very cheaply. (click to enlarge) Source: Dealogic Though many hedge funds have been seeking to deploy additional capital in the space, demand has still been slow to catch up with supply. The result is that merger arb has been becoming more interesting at the same time that most other strategies and equity beta have become less attractive. One illustrative data point is that the number of $100m+ deals with annualized spreads over 15% ballooned from late 2014 to now, as shown below. Source: SINLetter Less Beta when Beta is Most Overvalued In the current environment with high equity valuations and abundant macro dangers, another potential attraction of merger arb is its risk profile, as noted above. For each deal, the main sources of risk are idiosyncratic/company-specific (e.g., antitrust investigations, unwieldy regulatory reviews, loss of financing). It is true that merger arb still retains some exposure to general risk premiums, or the tendency of market participants to require higher returns to hold any investments during times of fear. Further, the probability of deals breaking does increase somewhat when market is stressed, particularly for deals with financing contingencies (e.g., LBOs). However, the recent M&A boom has predominately represented strategic deals with relatively few LBOs. Also, the level of exposure to general risk premiums is lessened due to the short duration, self-realizing nature of the strategy. Accordingly, the strategy has tended to produce much lower drawdowns than the overall equity market during past market shocks. For instance, in 2008-2009, the CSFB risk arbitrage index posted a maximum drawdown of roughly 20% vs. roughly 50% for the S&P 500. In 2000-2001, the risk arb index posted a max drawdown under 10% vs. ~40% for the S&P 500. Conclusion For those with interest/experience in event-driven investing, this is a good time in the cycle to explore opportunities in merger arb. For those with less experience or time to underwrite the risks of individual deals, a diversified approach may be worthy of consideration, for instance through one of the ETFs that exist today. Disclosure: I am/we are long DTV, MEA, OVTI, OWW, DARA, PNK, ODP. (More…) I wrote this article myself, and it expresses my own opinions. I am not receiving compensation for it (other than from Seeking Alpha). I have no business relationship with any company whose stock is mentioned in this article.