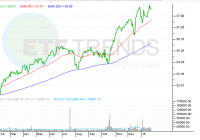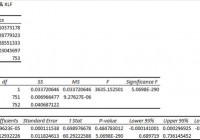
I’ll take a look at XLF to see if it makes sense for me. The liquidity is fantastic, but the description of the holdings sounded more diversified than the actual holdings in the portfolio. The ETF looks very solid for investors that have a large enough portfolio to make it worth investing a small percentage. The holdings aren’t bad, and the expense ratio looks very appealing. Investors should be seeking to improve their risk adjusted returns. I’m a big fan of using ETFs to achieve the risk adjusted returns relative to the portfolios that a normal investor can generate for themselves after trading costs. I’m working on building a new portfolio and I’m going to be analyzing several of the ETFs that I am considering for my personal portfolio. One of the funds that I’m considering is the Financial Select Sector SPDR ETF (NYSEARCA: XLF ). I’ll be performing a substantial portion of my analysis along the lines of modern portfolio theory, so my goal is to find ways to minimize costs while achieving diversification to reduce my risk level. What does XLF do? XLF attempts to track the total return (before fees and expenses) of the Financial Select Sector Index. Substantially all of the assets (at least 95%) are invested in funds included in this index. XLF falls under the category of “Financial.” It sounds like the ETF would be very highly concentrated, but it includes everything from diversified financial services to REITs and banks. When I was first reading about the holdings, I was expecting more diversification than I found. You’ll see what I mean when I get to the holdings section. Does XLF provide diversification benefits to a portfolio? Each investor may hold a different portfolio, but I use the SPDR S&P 500 Trust ETF (NYSEARCA: SPY ) as the basis for my analysis. I believe SPY, or another large cap U.S. fund with similar properties, represents the reasonable first step for many investors designing an ETF portfolio. Therefore, I start my diversification analysis by seeing how it works with SPY. I start with an ANOVA table: (click to enlarge) The correlation is just over 91%. That’s a strong correlation and substantially higher than I would expect for the REITs inside the ETF. I’m expecting the banks may be pushing the correlation higher. As an investor using modern portfolio theory, I can still work with 91%. Of course, the computed correlation wouldn’t mean much if the values were being distorted by poor liquidity. The average volume of more than 40 million shares per day suggests that liquidity shouldn’t be a concern. That’s a good sign for investors wanting verification of the statistics or wanting to know that they can exit the position with less concern about it deviating from NAV. Standard deviation of daily returns (dividend adjusted, measured since November 2013) The standard deviation is a bit high, but not absurd. For XLF it is .939%. For SPY, it is 0.736% for the same period. The ETF is definitely showing more volatility than SPY by a noticeable margin when we compare returns on a daily basis. Given the fairly strong correlation, I’m not expecting the ETF to be able to lower the risk level in the portfolio. Mixing it with SPY I run comparisons on the standard deviation of daily returns for the portfolio assuming that the portfolio is combined with the S&P 500. For research, I assume daily rebalancing because it dramatically simplifies the math. With a 50/50 weighting in a portfolio holding only SPY and XLF, the standard deviation of daily returns across the entire portfolio is 0.819%. With 80% in SPY and 20% in XLF, the standard deviation of the portfolio would have been .763%. If an investor wanted to use XLF as a supplement to their portfolio, the standard deviation across the portfolio with 95% in SPY and 5% in XLF would have been .742%. As expected, even solid diversification can’t quite eliminate the additional volatility. However, that does not necessarily indicate that there is anything wrong with the ETF. 40 million shares don’t trade hands without plenty of buyers. Why I use standard deviation of daily returns I don’t believe historical returns have predictive power for future returns, but I do believe historical values for standard deviations of returns relative to other ETFs have some predictive power on future risks and correlations. Yield & Taxes The distribution yield is 1.61%. The SEC yield is 1.52%. I like to see strong yields for retiring portfolios because I don’t want to touch the principal. By investing in ETFs I’m removing some of the human emotions, such as panic. Higher yields imply lower growth rates (without reinvestment) over the long term, but that is an acceptable trade off in my opinion. The yield is a little low for those purposes, but not low enough to make it unworkable. Expense Ratio The ETF is posting an expense ratio of .16%. I want diversification, I want stability, and I don’t want to pay for them. An expense ratio of .16% is great. I’ve got no issues there. That’s a very reasonable expense ratio to pay on the ETF. Market to NAV The ETF is at a .01% premium to NAV currently. Premiums or discounts to NAV can change very quickly so investors should check prior to putting in an order. For the extremely high volume of shares trading hands, I would expect the NAV and price to move hand in hand. Largest Holdings The diversification in the holdings isn’t going to be a strong selling point. I certainly don’t mind Berkshire Hathaway as a top holding, but to me this remains a bank ETF. The biggest REIT position is Simon Property Group (NYSE: SPG ). I have nothing against SPG, but it is also the biggest REIT position in most REIT ETFs. I like REIT ETFs, and I’m planning to use one or two in my portfolios. I don’t see much reason to get the same stock in the bank ETF, but with an expense ratio of only .16% it isn’t like I’d be getting charged much for holding it. (click to enlarge) Conclusion The correlation is a bit high, but given the major holdings I can’t expect anything less. I’m not overly bullish on the bank industry at the moment, but I’m not going to focus my ETF selections on my short term feelings about an industry. While I’m concerned about regulatory pressures, my concerns should already be priced into the stocks. For investors looking at the very long term picture, the extremely low expense ratio is great. When I’m putting together hypothetical portfolio positions, one of the things I include is the expense ratio of the ETFs to track the overall expense ratio on the portfolio. In that regard, I think XLF would do quite nicely. During my three year sample period the ETF did thoroughly outperform SPY. I wouldn’t count on it to happen again, but I would consider it as a significant possibility. Since I believe my regulatory concerns are already factored into the share prices for the major banks, I think the ETF would make a solid fit. The only real challenge I have in using the ETF is that I would want to limit the position to 5% of the portfolio. When the goal of the ETF portfolio is to minimize trading costs while maximizing diversification, investors have an incentive to avoid using ETF’s that are most suitable for small positions unless they have a way to trade it with no commissions. If I had a way to trade this ETF with no commissions, I’d probably put it in my portfolio. As it stands, paying the trading costs for 5% of the portfolio doesn’t offer enough benefits for me. Without substantial diversification benefits, I’m more likely to just use the extra money to buy more shares of the Vanguard Total Stock Market ETF (NYSEARCA: VTI ). When my portfolio grows to the point that it is worth separating out another 5%, I may take another look at XLF. It’s a solid ETF that just doesn’t happen to be the right match for my smaller portfolio. Disclosure: The author has no positions in any stocks mentioned, and no plans to initiate any positions within the next 72 hours. The author wrote this article themselves, and it expresses their own opinions. The author is not receiving compensation for it (other than from Seeking Alpha). The author has no business relationship with any company whose stock is mentioned in this article. Additional disclosure: Information in this article represents the opinion of the analyst. All statements are represented as opinions, rather than facts, and should not be construed as advice to buy or sell a security. Ratings of “outperform” and “underperform” reflect the analyst’s estimation of a divergence between the market value for a security and the price that would be appropriate given the potential for risks and returns relative to other securities. The analyst does not know your particular objectives for returns or constraints upon investing. All investors are encouraged to do their own research before making any investment decision. Information is regularly obtained from Yahoo Finance, Google Finance, and SEC Database. If Yahoo, Google, or the SEC database contained faulty or old information it could be incorporated into my analysis. The analyst holds a diversified portfolio including mutual funds or index funds which may include a small long exposure to the stock.