Stocks: Not The Final Frontier
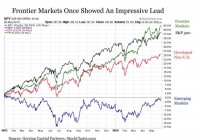
Summary Initially, it appeared that frontier markets were an innovative new asset class making its mark on the investment landscape. But over the past year, it has been revealed that investors may be better served by staying off the frontier. A closer look at frontier markets shows the effective exposure that investors have actually been getting with such an allocation. Initially, it appeared that an innovative new asset class was making its mark on the investment landscape. Frontier markets take an additional step beyond emerging markets by focusing on those countries that are typically at the earliest stages of economic, political and financial development. And for a period of time over the last few years, it appeared that this burgeoning global asset class was showing the potential to provide meaningfully differentiated performance to further enhance portfolio diversification and returns potential. But over the past year, it has been revealed that investors may be better served by staying off the frontier at least for the time being. Portfolio Manifest Destiny Frontier markets have an understandable appeal for many investors. The fact that these countries are typically at the earliest stages of development brings with it the fact that they also often offer the greatest growth potential across the global investment landscape. For some time in recent years, frontier markets were also demonstrating themselves as a portfolio differentiator as well. For from the start of 2013 through the middle of 2014, frontier markets according to the iShares MSCI Frontier 100 ETF (NYSEARCA: FM ) was the best performing aggregate global asset class with a cumulative return of +42.58%. Not only were these results better than U.S. markets at +38.53% on the S&P 500 Index (NYSEARCA: SPY ), but they were also meaningfully better than developed non-U.S. markets as measured by the MSCI EAFE ETF (NYSEARCA: EFA ) at +25.62%. (click to enlarge) But perhaps most notable was the performance of frontier markets in comparison to their emerging market counterparts. For a while, frontier markets had exploded to the front of the returns pack over this time period, its closely related emerging market counterparts were negative over this same time period at just under -2% on the MSCI Emerging Market ETF (NYSEARCA: EEM ). Adding even further to the appeal for frontier markets was the fact that they were achieving these outsized returns at a level of risk based on the standard deviation of weekly returns that was comparable to U.S. markets as measured by the S&P 500 Index that were 10% less volatile than developed non-U.S. markets that includes the likes of Germany (NYSEARCA: EWG ) and Switzerland (NYSEARCA: EWL ), and were 30% less volatile than emerging markets. In short, frontier markets were exhibiting themselves to be a real portfolio differentiator in the fact that it was the high growth segment of the global equity markets that was otherwise difficult to access but was providing attractive returns at a relatively low level of risk with a correlation of returns that was meaningfully different than its global market counterparts. It was all coming together beautifully for the relatively new asset class. Trouble On The Frontier But then came last summer, and everything suddenly changed for frontier markets. The asset class suddenly took a sharp turn to the downside. From June to December 2014, frontier markets lost nearly -20% of their value before rebounding. But they have since faded and are now threatening to break to new lows. Over this time period since last June, frontier markets have been by far the worst performing asset class among its global peers including emerging markets that have been down only -10% and the endlessly levitating S&P 500 Index that is still up +12% over this same time period. (click to enlarge) So What Happened? So what exactly went suddenly wrong for frontier markets over the past year? For the answer, it is worthwhile to dig deeper under the surface to see exactly what makes up frontier markets. From a sector perspective, the answer is not readily apparent. Just over half of the iShares MSCI Frontier 100 ETF is made up of financials. And it’s not as though the news headlines have been tracking the struggle of financial institutions across the far reaches of the globe outside of Greece. But when we begin to examine frontier markets from a country perspective, the answer starts to present itself. Twenty five countries are included in the MSCI Frontier Markets 100 Index. From that list, fifteen of these countries are sufficiently large in size that they are included in the iShares MSCI Frontier 100 ETF. And leading among these are Kuwait at 26% of the portfolio weight and Nigeria at 13%. In short, a frontier markets position via the FM is highly concentrated with exposures to just two countries making up nearly two-fifths of the entire allocation. And just for the basis of comparison, the older Guggenheim Frontier Markets ETF (NYSEARCA: FRN ) whose performance in recent years has been considerably worse than its FM counterpart also lists Kuwait and Nigeria as its top two country allocations with a combined 29%. This comes after Guggenheim imposed a 15% country cap back in April 2015, as until recently was even more concentrated with a 37% allocation to Chile that has since been completely removed from the product. In short, an allocation to frontier markets via an exchange traded fund is highly concentrated. And the countries that are most heavily weighted are those whose economies are heavily dependent on oil and oil exports for growth. And one has to look no further than the price performance of the Nigerian stock market (NYSEARCA: NGE ) over the past year to see the impact from sharply declining oil prices on these types of frontier economies. (click to enlarge) Taking this a step further, examining frontier markets through a different lens reveals what type of exposure investors are effectively buying with such an allocation. For a while, they have deviated a bit thus far on the way back down, a price chart comparison reveals that owning frontier markets looks and feels a lot like holding an allocation to the U.S. energy sector as measured by the Energy Select Sector SPDR (NYSEARCA: XLE ). (click to enlarge) More specifically, one could have owned individual holdings such as EOG Resources (NYSE: EOG ), Schlumberger (NYSE: SLB ) or Anadarko Petroleum (NYSE: APC ) and had a very similar returns experience to what owning the frontier markets have provided over the last few years. (click to enlarge) All of this raises an important question for investors thinking about portfolio diversification and risk control. Is it preferable for U.S. based investors to take on the additional uncertainties associated with economic, political, financial and added currency risk by making an allocation beyond the emerging market space to frontier markets, or are they better off allocating to the U.S. energy sector where at least some of these uncertainties are neutralized. Bottom Line For those seeking additional portfolio diversification, adding an allocation to frontier markets may not be worth the trouble, at least so far as the available exchange traded fund offerings are concerned. With that said, there are 23 other countries in the MSCI frontier market universe beyond Kuwait and Nigeria that investors with a very high risk tolerance might wish to consider as an alternative. The only challenge is that many of these countries such as Kenya, Oman, Morocco, Romania, Bangladesh and Kazakhstan do not yet have individual country specific ETF offerings. Beyond Nigeria, three countries in the MSCI frontier market universe do have country specific ETF offerings. These are Argentina (NYSEARCA: ARGT ), Pakistan (NYSEARCA: PAK ) and Vietnam (NYSEARCA: VNM ). But once again, I am not recommending any such individual country allocations to frontier markets and those that might be inclined to consider it should have a very high risk tolerance, an in depth knowledge of the underlying economy and the ability to proceed with great care. Otherwise, investors seeking to consider the type of diversification provided by frontier markets may instead wish to monitor the U.S. energy sector at least as long as the oil and commodity producing nations play such a major role in this frontier area of the market. Disclosure : This article is for information purposes only. There are risks involved with investing including loss of principal. Gerring Capital Partners makes no explicit or implicit guarantee with respect to performance or the outcome of any investment or projections made. There is no guarantee that the goals of the strategies discussed by Gerring Capital Partners will be met. Disclosure: I/we have no positions in any stocks mentioned, and no plans to initiate any positions within the next 72 hours. (More…) I wrote this article myself, and it expresses my own opinions. I am not receiving compensation for it (other than from Seeking Alpha). I have no business relationship with any company whose stock is mentioned in this article.