Tag Archives: nreum

Adaptive Allocation Applied To A Wasatch Mutual Funds Portfolio

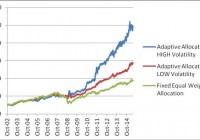
Summary Wasatch Mutual Funds may be used to create a highly profitable portfolio. A fixed allocation portfolio of Wasatch mutual funds delivered good returns over the 2002–2015 time interval. Over the 2002–2007 time interval, the adaptive allocation did not perform better. Adaptive allocation improved the performance substantially only in the 2007–2015 time interval. The following Wasatch funds are used for building the portfolio: Wasatch-Hoisington US Treasury (MUTF: WHOSX ) Wasatch Micro Cap (MUTF: WMICX ) Wasatch Small Cap Growth (MUTF: WAAEX ) Wasatch International Growth (MUTF: WAIGX ) Three different investment strategies will be presented: (1) Fixed Allocation – Portfolio is invested 25% in each fund without rebalancing. (2) Target Allocation – Portfolio is invested 25% in each fund and is rebalanced when the allocation deviates from target by more than 10%. (2) Adaptive Allocation – Portfolio is invested dynamically among the four funds based on a variance-return optimization algorithm developed on the Modern Portfolio Theory (Markowitz). The allocation is rebalanced at fixed one-month intervals. Basic information about the funds was extracted from Yahoo Finance and is shown in table 1. Table 1 Symbol Inception Date Net Assets Yield% Category WHOSX 12/08/1986 322M 2.21 LT Treasury Bonds WMICX 6/19/1995 314M 0.02 Small Cap Growth WAAEX 12/08/1986 2.33B 0.0 Small Cap Growth WAIGX 6/28/2002 1.41B 0.02 Mid Cap Growth The portfolio is built of a high quality bond fund, WHOSX, two US growth funds, WMICX and WAAEX, and an international growth fund, WAIGX. The results reported in this article cover a period of over twelve years between October 1, 2002 and May 31, 2015. The starting day was selected based on availability of historical data of the funds by adding a period of 65 trading days for initial estimation of the parameters used for optimization. In table 2, we show the buy-and-hold results of investing in each fund. Table 2. Symbol T Return % CAGR % max DD% VOL % Sharpe Sortino WHOSX 151.25 7.56 -27.57 16.19 0.47 0.69 WMICX 284.56 11.24 -65.21 22.62 0.50 0.63 WAAEX 288.05 11.32 -56.48 21.62 0.52 0.69 WAIGX 382.57 13.26 -67.66 18.54 0.72 0.85 SPY 186.52 8.68 -55.19 19.61 0.44 0.54 In table 3, we show the simulation results for the portfolios from October 1, 2002 to June 1, 2015. We applied four strategies: Fixed equal weight allocation Target allocation with rebalancing Adaptive allocation for a LOW volatility target Adaptive allocation for a HIGH volatility target Table 3. Tot Ret % CAGR % NO. trad max DD% VOL % Sharpe Sortino Fixed allocation 276.61 11.06 0 -51.48 14.22 0.78 1.00 Target allocation 319.20 12.00 57 -47.68 13.66 0.88 1.14 Adapt. allocation LOW 472.58 14.80 152 -22.68 10.33 1.43 2.01 Adapt. allocation HIGH 902.50 19.74 152 -22.19 14.54 1.36 1.85 As can be seen in table 3, the adaptive allocation with a low volatility target realizes the highest risk adjusted returns, i.e. the highest Sharpe ratio. In figure 1, we show the graphs of the portfolio equities. (click to enlarge) Figure 1. Equity curves for the portfolio with adaptive allocation and the portfolio with fixed allocation without rebalancing. Source: This chart is based on calculations using the adjusted daily closing share prices from finance.yahoo.com. From figure 1, we can see that the fixed allocation performed the best between October 1, 2002 and December 31, 2007. Only starting from January 1, 2008, the adaptive allocations displayed much better performance. As it is already well known, tactical allocation of funds in a portfolio with equities and bonds perform much better during financial crises than fixed allocation. But, it is surprising that the outperformance of the tactical allocation continues to be very strong during a strong bull market. In figure 2, we show the time variation of the adaptive allocation with a low volatility target. As can be seen, the strategy allocated about half of the funds to the bond treasury fund WHOSX over the entire time. This is so because WHOSX is the fund with the lowest volatility. (click to enlarge) Figure 2. Portfolio allocation for a low volatility target. Source: This chart is based on calculations using the adjusted daily closing share prices from finance.yahoo.com. In figure 3, we show the time variation of the adaptive allocation with a high volatility target. (click to enlarge) Figure 3. Portfolio allocation for a high volatility target. Source: This chart is based on calculations using the adjusted daily closing share prices from finance.yahoo.com. Conclusion The Wasatch family of mutual funds is very suitable for creation of investment portfolios with good overall performance. Although fixed asset allocation with rebalancing works quite well, the performance of Wasatch portfolios can benefit greatly from using an adaptive asset allocation strategy. The adaptive allocation strategy is very flexible and allows the investor to adjust the level of risk to match an investor’s risk profile. Additional disclosure: The article was written for educational purposes and should not be considered as specific investment advice. Disclosure: I/we have no positions in any stocks mentioned, and no plans to initiate any positions within the next 72 hours. (More…) I wrote this article myself, and it expresses my own opinions. I am not receiving compensation for it (other than from Seeking Alpha). I have no business relationship with any company whose stock is mentioned in this article.

Today’s Most Competitive Wealth-Builder ETF Investment

Summary From a population of some 350 actively-traded, substantial, and growing ETFs this is a currently attractive addition to a portfolio whose principal objective is wealth accumulation by active investing. We daily evaluate future near-term price gain prospects for quality, market-seasoned ETFs, based on the expectations of market-makers [MMs], drawing on their insights from client order-flows. The analysis of our subject ETF’s price prospects is reinforced by parallel MM forecasts for each of the ETF’s ten largest holdings. Qualitative appraisals of the forecasts are derived from how well the MMs have foreseen subsequent price behaviors following prior forecasts similar to today’s. Size of prospective gains, odds of winning transactions, worst-case price drawdowns, and marketability measures are all taken into account. Today’s most attractive ETF Is the SPDR Biotech ETF (NYSEARCA: XBI ): The investment seeks to provide investment results that, before fees and expenses, correspond generally to the total return performance of an index derived from the biotechnology segment of a U.S. total market composite index. In seeking to track the performance of the S&P Biotechnology Select Industry Index (the “index”), the fund employs a sampling strategy. It generally invests substantially all, but at least 80%, of its total assets in the securities comprising the index. The index represents the biotechnology industry group of the S&P Total Market Index (“S&P TMI”). The fund is non-diversified. The fund currently holds assets of $2.28 billion and has had a YTD price return of +27.87%. Its average daily trading volume of 1,069,010 produces a complete asset turnover calculation in 8.5 days at its current price of $250.86. Behavioral analysis of market-maker hedging actions while providing market liquidity for volume block trades in the ETF by interested major investment funds has produced the recent past (6 month) daily history of implied price range forecasts pictured in Figure 1. Figure 1 (used with permission) The vertical lines of Figure 1 are a visual history of forward-looking expectations of coming prices for the subject ETF. They are NOT a backward-in-time look at actual daily price ranges, but the heavy dot in each range is the ending market quote of the day the forecast was made. What is important in the picture is the balance of upside prospects in comparison to downside concerns. That ratio is expressed in the Range Index [RI], whose number tells what percentage of the whole range lies below the then current price. Today’s Range Index is used to evaluate how well prior forecasts of similar RIs for this ETF have previously worked out. The size of that historic sample is given near the right-hand end of the data line below the picture. The current RI’s size in relation to all available RIs of the past 5 years is indicated in the small blue thumbnail distribution at the bottom of Figure 1. The first items in the data line are current information: The current high and low of the forecast range, and the percent change from the market quote to the top of the range, as a sell target. The Range Index is of the current forecast. Other items of data are all derived from the history of prior forecasts. They stem from applying a T ime- E fficient R isk M anagement D iscipline to hypothetical holdings initiated by the MM forecasts. That discipline requires a next-day closing price cost position be held no longer than 63 market days (3 months) unless first encountered by a market close equal to or above the sell target. The net payoffs are the cumulative average simple percent gains of all such forecast positions, including losses. Days held are average market rather than calendar days held in the sample positions. Drawdown exposure indicates the typical worst-case price experience during those holding periods. Win odds tells what percentage proportion of the sample recovered from the drawdowns to produce a gain. The cred(ibility) ratio compares the sell target prospect with the historic net payoff experiences. Figure 2 provides a longer-time perspective by drawing a once-a week look from the Figure 1 source forecasts, back over two years. Figure 2 (used with permission) What does this ETF hold, causing such price expectations? Figure 3 is a table of securities held by the subject ETF, indicating its concentration in the top ten largest holdings, and their percentage of the ETF’s total value. Figure 3 source: Yahoo Finance XBI apparently takes a low-concentration approach to holdings, with an average of 1 ½% of its assets in each of its top ten commitments. This provides a wide dispersion of holdings among competitive contestants in an industry where success rewards can be huge, while failures tend to be complete. If the remaining 85% of assets are distributed on a 1% basis 95 separate bets may being made, offering great diversification, as well as dilution of encountered bonanzas. Where ultimate payoffs are less dependent on initial capital commitment size, this may be an advantaged strategy. Figure 4 is a table of data lines similar to that contained in Figure 1, for each of the top ten holdings of XBI. Figure 4 (click to enlarge) In an industry as unpredictably dynamic as this, wide variations in market experience seem to be the rule. Column (5) contains the upside price change forecasts between current market prices and the upper limit of prices regarded by MMs as being worth paying for price change protection. The average of +16.3% of the top ten XBI holdings is well above the population average of all 2600+ equities MM forecasts of +12.9%. It is about double the upside forecast for SPY price change prospects. The other side of the coin is column (6), which shows what actual worst-case price drawdowns have been typical in the 3 months following each time there has been a forecast like those of the present day. Those risk exposures have been nearly -10% in the holdings top ten, less than -9 by equities at large, and only -3.5% on the SPY ETF. But these holdings are attractive reward tradeoffs between returns and risks, with the top ten (column 14) at a ratio of 1.7, compared to equities overall at 1.5 times. Still, the market average of SPY provides a best ratio of 2.5 times risk avoidance. Another qualitative consideration is the credibility of the ten XBI big holdings after previous forecasts like today’s. The net average price change (column 13) of the ten has been 1.1 times the size of the upside forecast average, +17.4% compared to +16.3%. The equity population’s actual price gain achievement, net of losses has been a pitiful +3.7% compared to promises of 12.9%. The ability of XBI holdings to recover from those worst-case drawdowns and achieve profits occurred in 84% of experiences. The equity population only recovered less than two thirds of the time, and while the SPY experiences were more consistent like the ten XBI holdings, the achieved gains were much smaller. SPY has had only +3.3% gains previously from like forecasts of +8.6%. Conclusion XBI provides attractive forecast price gains, supported by equally appealing largest holdings. Both the ETF and many of its major holdings offer very attractive prospects in near-term price behaviors, demonstrated by previous experiences following prior similar forecasts by market makers. Disclosure: I/we have no positions in any stocks mentioned, and no plans to initiate any positions within the next 72 hours. (More…) I wrote this article myself, and it expresses my own opinions. I am not receiving compensation for it (other than from Seeking Alpha). I have no business relationship with any company whose stock is mentioned in this article.

Taylor Swift > Apple

Summary Taylor Swift lights up Apple over plans to stiff musicians. Apple blinked. This creates a huge opportunity for fans & costs Apple a fortune. When pop stars attack Yesterday, Taylor Swift announced that she would pull her album, 1989, from Apple (NASDAQ: AAPL ) Music. My first reaction was: 1989? Someone could have been born in 1989? Jeesh she is young. My second thought is that she writes well and knows how to get what she wants. Her concern is that Apple Music was going to offer a free three-month trial without paying the talent behind the music. So she light them up as, shocking, disappointing, and completely unlike this historically progressive and generous company. She has a point The often exploitative nature of the music industry’s high-priced helpers has long been a complaint of singers and songwriters; what is new is that individual singers are going out of their way to use their clout to push back. After the free three months, Apple intended to pay music owners 71.5% of the subscription revenue, which is consistent with the industry standard. While this would not be problematic for established musicians, it would be a long wait for newer, smaller labels and independent artists. Apple caves It took only seventeen hours for Taylor Swift’s message to get through to Apple. Apple exec Eddy Cue came out on Twitter (NYSE: TWTR ) to say that Apple will make certain that musicians are paid, even during the free trial period. Apple made up with Swift fast . Music arbitrage This turns a potential negative for musicians into a huge commercial bonanza – every singer and band with a big online follower can specifically encourage free streaming for a full quarter of a year with streaming royalties passed on to the musicians. This will cost the fans nothing. This will make their favorite musicians money. It will cost Apple a boatload, but at least they got some good free press. The industry takes a lot out of the artists… now bands and fans can use this free trial period to get a little back. Just keep streaming your favorite music for ninety days starting on June 30, 2015. Powerful interests vs. other powerful interests Businesses – especially hip, modern businesses such as Apple – like to imply that their principles guide the negotiations with their counterparties. The reality is that their behavior is guided primarily by their interests . As a shareholder-owned firm, that is as it should be. Once those shareholders are enriched, they can use those resources to support starving artists or whatever else they want to do. This victory for musicians did not come from trying to argue about principles when it is really about interests. It came from competing interests, and concentrated interests at that. Sure, Taylor can protest that this was never about her and that she can go without pay for a few months… but her protest (again, utterly appropriately) was 100% aligned with her interests. Only when a star with enough clout went head-to-head against Tim Cook did Apple back down. Conclusion Free enterprise has a remarkable knack for restoring equilibrium. In many cases (such as shareholder activism) this self-righting tendency is strengthened by the presence of concentrated interests that can offset other concentrated interests. It can be the very inequality of people such as Taylor Swift that most benefits the types of young, independent artists that are poorly positioned to protect themselves. Rhetorically, Apple executives (and just about everyone else) like to talk about their principles, but they act upon their interests. If they did not, then someone else would and that interloper would quickly take over Apple’s markets. So, if you want to be able to predict behavior, follow interests. Oh, and don’t mess with Taylor Swift . Disclosure: I am/we are long AAPL. (More…) I wrote this article myself, and it expresses my own opinions. I am not receiving compensation for it (other than from Seeking Alpha). I have no business relationship with any company whose stock is mentioned in this article. Additional disclosure: Chris DeMuth Jr is a portfolio manager at Rangeley Capital. Rangeley invests with a margin of safety by buying securities at deep discounts to their intrinsic value and unlocking that value through corporate events. In order to maximize total returns for our investors, we reserve the right to make investment decisions regarding any security without further notification except where such notification is required by law.