Tag Archives: nreum

Revisiting The ‘Problem’ With Leveraged ETFs

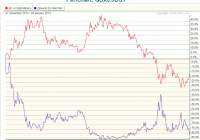
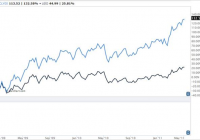
Editor’s note: Originally published at tsi-blog.com on January 6, 2015. My 3rd November blog post explained why leveraged ETFs should only ever be used for short-term trades. To set the scene, here is an excerpt from this earlier post: The crux of the matter is that leveraged ETFs are designed to move by 2 or 3 times the DAILY percentage changes of the target indexes. They are NOT designed to move by 2 or 3 times the percentage change of the target indexes over periods of longer than one day. Due to the effects of compounding, their percentage changes over periods of much longer than one day will usually be less – and sometimes substantially less – than 2-times (in the case of a 2X ETF) or 3-times (in the case of a 3X ETF) the percentage changes in the target indexes. In the earlier post, I presented tables to show that the greater the volatility of an index and the greater the leverage provided by an ETF linked to the index, the worse the likely performance of the leveraged ETF over extended periods. The worse, that is, relative to the performance superficially implied by the daily percentage change relationship between the index and the leveraged ETF. I concluded that leveraged ETFs are only suitable for short-term trades and that a trade should be very short term if it involves a 3X ETF and/or a volatile market. To illustrate how badly a leveraged ETF can perform relative to the performance superficially implied by the daily percentage change relationship between the leveraged ETF and the market to which it is linked, here is a chart comparing the performances of the Market Vectors Junior Gold Miners ETF ( GDXJ) and the Direxion Daily Junior Gold Miners Index Bear 3X Shares ETF ( JDST) since the end of 2013. JDST is designed to have a daily percentage change that is roughly three times the INVERSE of GDXJ’s daily percentage change, so it is an ETF that someone would buy if they were bearish on GDXJ. For example, on a day when GDXJ lost 5%, JDST would gain about 15%, and on a day when GDXJ gained 5%, JDST would lose about 15%. Given that GDXJ is presently about 15% lower than it was at the end of 2013, people who are unfamiliar with how leveraged ETFs work would likely jump to the conclusion that a JDST position purchased at the end of 2013 and held through to the present would show a healthy profit. However, this conclusion could not be further from the truth, because JDST has lost 81% of its value over the period in question. The dismal performance of JDST is a trap for the novice trader, but it is not a design flaw. As outlined in my 3rd November post, it is a mathematical function of how the leverage works and simply means that this type of ETF should only ever be used in trades with time frames of no more than a few weeks. Now that you’ve read this, are you Bullish or Bearish on ? Bullish Bearish Sentiment on ( ) Thanks for sharing your thoughts. Why are you ? Submit & View Results Skip to results » Share this article with a colleague

Best And Worst Performing Currency ETFs Of 2014

Currency markets had an eventful 2014 with the U.S. dollar touching multi-year highs against a basket of major currencies. Improving U.S. economic data, escalating geopolitical tensions, diverging central bank policies around the world and chances of a sooner-than-expected rate tightening cycle in the U.S. were some of the factors contributing to a stronger greenback. In fact, divergence in monetary policies across the globe was one of the primary factors for the strong advance in dollar this year against major currencies. While the Fed has wrapped up its QE program and is expected to start raising rates sometime this year, central banks of some of the major developed nations have stepped up their monetary stimulus programs to stimulate their struggling economies. Stronger U.S. recovery and speculations of a faster-than-expected rate hike are leading investors to pull out capital from emerging markets and pour it into U.S. stocks, causing the currencies of these nations to take a plunge. Given this, we have highlighted two of the best performing and worst performing currency ETFs of 2014 below. These were big movers in the currency market, and undoubtedly investors are expecting big things out of these currencies in 2015 as well: Best Currency ETFs of 2014 Market Vectors Indian Rupee/USD ETN (NYSEARCA: INR ) Indian equity markets have posted stellar performances this year driven by optimism over the new pro-reform, business-friendly government led by Prime Minister Narendra Modi. In fact, the Indian economy has been witnessing improving macroeconomic conditions led by better-than-expected corporate earnings, a falling inflation level and improving manufacturing and industrial production. Moreover, steps taken by the RBI governor have been successful in narrowing the current account deficit. These factors led the Indian rupee to be the best performing major currency worldwide against the dollar during 2014 and INR to be the best currency ETF this year. The fund tracks the performance of the S&P Indian Rupee Total Return Index, providing exposure to exchange rate movement of the U.S. Dollar against the Indian Rupee. The product is, however, quite unpopular and illiquid with an asset base of under $2 million and average trading volume of 27,000 shares a day. The fund charges 55 basis points as fees and has returned 14% this year. INR currently has a Zacks ETF Rank #3 or Hold rating. PowerShares DB USD Bull ETF (NYSEARCA: UUP ) Thanks to a stronger U.S. economic recovery led by higher-than-expected U.S. GDP growth numbers, renewed optimism in housing activity, continued job creation and rising consumer confidence combined with global factors, the U.S. dollar emerged as a strong currency this year. The fund tracks the performance of the Deutsche Bank Long US Dollar Index (USDX) Futures Index to provide exposure to the performance of U.S. Dollar against the following currencies: Euro, Japanese Yen, British Pound, Canadian Dollar, Swedish Krona and Swiss Franc. In terms of holdings, UUP allocates nearly 58% in Euro, while 25% collectively in Japanese Yen and British Pound. The fund has so far managed an asset base of $959.9 million and sees an average daily volume of 1.8 million shares. It charges 80 bps in total fees and expenses. The fund has added 11.3% in 2014 and has a Zacks ETF Rank of 2 or ‘Buy’ rating with Medium risk outlook. Worst Currency ETFs of 2014 CurrencyShares Swedish Krona Trust ETF (NYSEARCA: FXS ) The Swedish Krona has been among the worst performing currencies in 2014 against the greenback, with FXS plunging 18% this year. This is especially true as the currency is struggling badly in the wake of record low interest rates and deflationary pressures. The central bank’s unexpected move to slash interest rates to zero in October in order to fight deflation further aggravated the situation and led the currency to struggle badly against the U.S. Dollar. The fund tracks the price of the Swedish Krona relative to the U.S. Dollar managing an asset base of $25.3 million. The fund is quite illiquid with average daily volume of just 2,000 shares. The fund charges 40 basis points as fees and currently has a Zacks ETF Rank #3 or Hold rating. CurrencyShares Japanese Yen Trust ETF (NYSEARCA: FXY ) Though the Yen was performing well in the first part of the year due to its safe haven appeal in the wake of rising geopolitical tensions, it plummeted to a seven-year low in the second half due to an ultra loose monetary policy adopted by the Bank of Japan (BoJ). Weakening growth conditions and sliding consumer prices led the BoJ to expand its monetary policy in 2014 leading to a slumping Yen. FXY measures the relative values of two currencies, the Japanese Yen against the U.S. Dollar. The fund gains in value as the Yen appreciates relative to the Dollar. The fund manages an asset base of $105 million, charges 40 basis points as fees and trades with good volumes of 200,000 shares a day. FXY plunged roughly 13.7% for 2014, continuing its long term track record of weakness and pushing its two year loss to -27%.

How To Play A Bounce In Oil. Hint: Not USO

It’s the first (real) week back from holiday break, but the story is the same as it was before Christmas, and before Thanksgiving for that matter…. Crude Oil continues to fall like a lead oil filled balloon, falling below the $50 mark on Monday for the first time since 2009. It’s even gotten to the point of family and friends asking where we think Crude Oil will bottom at parties and dinners, getting our contrarian antennas perked up. The million, or actually Trillion, dollar question is where will Crude finally find a bottom and bounce back? Fortune let us know recently that the $55 drop in Brent Oil prices represents about a Trillion dollars in annual savings. Now, while some are no doubt betting on continued downside with the recent belles of the ball – the inverse oil ETFs and ETNs (the PowerShares DB Crude Oil Double Short ETN (NYSEARCA: DTO ), ProShares UltraShort Bloomberg Crude Oil ETF (NYSEARCA: SCO ) and VelocityShares 3x Inverse Crude Oil ETN (NYSEARCA: DWTI ) ), the last of which is up a smooth 527% since July {past performance is not necessarily indicative of future results}. Others are no doubt positioning for the inevitable rebound in energy prices, thinking it is just a matter of when, not if. Crude Oil is back around $70 to $100 a barrel. And what a trade that would be. Consider a move back to just $75 a barrel, the very low end of where Crude spent the last 5 years, would be a 50% return from the current $50 level. It seems like that could happen nearly overnight without anyone really thinking much about it. So how do you play a bounce in Oil? Well, the most popular play, by size and volume ( $1.2 Billion in Assets , $387 million changing hands daily), is no doubt the The United States Oil ETF, LP (NYSEARCA: USO ) . But is that really the best way to ‘play’ a bounce? Consider that USO Is designed to track the “daily” movement of oil. What’s the matter with that? One would hope that the ETF closely matches the daily move of Oil, right? Well, yes and no. Yes if you are going to buy the ETF for one day, or even a couple of days; no if your investment thesis is oil prices will climb higher over an extended period of time. Because, and here’s where it gets tricky – USO’s long term price appreciation won’t match the sum of its daily price appreciations. What? How is that possible? You see, the ETF works by buying futures contracts on Oil, and there are 12 different contracts in Crude Oil futures each year, you guessed it – one for every month. And while the so called ‘front month contract’ is trading near the number you see on the news every night ($50 yesterday), the further out contracts, such as 10 to 12 months from now, may already reflect the idea that Oil prices will be higher. Indeed, the price for the December 2015 contract is $57, versus $50 for the front month. So there’s $7, or a 14% gain, already “built in” to the futures price. What’s that mean for the ETF investor? Well, if you are correct that Oil will rebound, and it does so, to the tune of rising 14%, or $7 per barrel, over the next 11 months; the ETF likely won’t appreciate 14% as well. It likely won’t move at all, because it will have to sell out of its expiring futures positions and buy new futures positions each month. This means it will essentially have to “pay” that $7 in what’s called “roll costs.” This is why USO has drastically underperformed the “spot price” of Oil over the past five years, with USO having lost -39 % while the spot price of Oil went UP 48 %. It is like an option or insurance premium – a declining asset with all else held equal. Just look at what happened during the last big rally for energy prices between January 2009 and May 2011. That’s a 110% difference between what you thought was going to happen and what the ETF rewarded you with. (click to enlarge) (Disclaimer: Past performance is not necessarily indicative of future results) Chart Courtesy: Barchart So if you think Oil will be higher 3 months from now, or 12 months from now, instead of tomorrow, USO is at best going to give you some discounted version of your expected gain, and at worse a possible loss when Oil gains. (P.S., the ProShares Ultra Bloomberg Crude Oil ETF (NYSEARCA: UCO ) will do all this, times two… yeah) You don’t even have to take our word for it. Take the description of the USO over at ETF.com . USO is a great vehicle for riding short-term moves in expected crude prices, but longer-term holders take on heavy roll risk. Roll costs can be steep when the curve is up-sloping. Ok – so don’t offer a problem without a solution… What other options are out there? Well, in our realm of futures based investments, you could: Trade futures in Crude Oil, Heating Oil, RBOB Gasoline that match your time frame for a rise in prices; rolling them once annually if needed, as we’ve recommended instead of commodity ETFs for some time now. For example, if you think Crude Oil will be higher 12 to 18 months from now, buy the June 2016 Crude Oil futures (currently It will still underperform the pure spot price, but will only pay that roll cost once per year instead of multiple times). Invest with an energy focused professional commodity trading advisor, we have some names. Invest with a trend following manager – who should benefit from a long term trend up (just as they are benefiting from the trend down right now {past performance is not necessarily indicative of future results}, albeit the energy portion would only be a small portion (