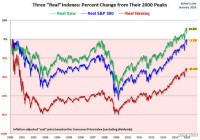
In step 1, we focused on asset classes and how asset allocation can make us better investors. Now we take a look at how these asset classes are correlated to each other (or not!). And we offer for your due diligence the ETFs and funds we believe are superior to the “usual suspects’. The Asset Allocation chart we showed in Step 1 of this series ( here ) engendered considerable valuable discussion in the comments section of that article. While I addressed all issues raised in that area, I want to say here, as well, that when I transferred the chart from our monthly investment publication, the text box crediting the source of that chart did not come through on what I submitted to SA. Mea culpa! I take others’ hard work as seriously as I do my own and appreciate their willingness to share the results of their research. That chart came from Novel Investor ( novelinvestor.com .) If you’d like to see the full-year ended 2014, that is now posted there as well. Until the Swiss Swooping Swan (we can’t really call it a Black Swan; it was wholly unexpected given the Swiss central bank’s protestations of just 48 hours prior, but it is not a cataclysmic event for US investors) the prevalent investing mantras went something like this: ^ “Be long the dollar, short the euro. There is no stopping the juggernaut that is the US dollar. Where else can you go?” ^ “Europe, China, Australia, Asia, et al are struggling. There’s no upside there.” ^ “Interest rates must rise now since the Fed must control inevitable inflation.” ^ “Emerging markets are dead, or at least in an extended coma.” ^ “Utilities, bonds and REITs must fall this year as rates rise.” ^ “Commodities are dead. Copper, iron, cotton, oil, gas, you name it – if it is subject to supply and demand, it is dead.” As further evidence that an Asset Allocation model protects you from market risk more effectively than simply buying a benchmark index fund, I believe that every one of those assumptions are now called into question as the Swiss, the Danes, and others have now tried to protect themselves from the inevitable and finally announced QE from the European Central Bank (working with and through the various national central banks, of course.) The point is that we never know when there will be a shot out of the blue that upsets our most treasured assumptions and calls into question our investing direction. Owning different asset classes reduces that risk considerably. With market history on our side, we will continue to allocate assets in a diverse manner, placing some funds into the areas that offer the most compelling valuations no matter what the CNBC talking-their-book talking heads expect. For instance, we don’t buy or sell something called “the EC.” We buy great European companies / multinationals that will continue to be great European companies / multinationals. We have tried to position our family and client portfolios for what we believe will be the sweet spot of this aging bull market, but we still diversify “just in case.” I believe the confluence of low rates, low inflation, institutions with money to spend, the typical small stock bias for the first two quarters, and the third year of the presidential election cycle will make for a most wonderful time of the year and possible a timely denouement for the bull, with the final year (if it proves to be) typically the one with the greatest volatility and the greatest overall returns. For those who believe the bull is too old and too tired to continue, I provide the chart below from Doug Short ( dshort.com ) which shows that, allowing for inflation, the “real” returns on the S&P 500 and the Nasdaq haven’t even yet returned to the highs they reached back in the year 2000. That’s why we view any pullback in January, like last year’s January decline, to be an opportunity to reallocate to our most favored sectors. Talking “Big Picture” Before I discuss some specific mutual funds, closed-ends and ETFs that our research has led us to consider in our asset allocation portfolios, I think it’s important to illustrate one other tool we use to ensure that we have appropriate diversification among asset classes. Some investors believe they are “diversified” because they split portfolio assets between Large Cap Growth, Blend and Value, Mid Cap Growth, Blend and Value, and Small Cap Growth, Blend and Value. There! 9 categories; that’s diversified! Except that it isn’t. These categories are all positively correlated. When the Dow is up, most often the S&P, the Nasdaq and the Russell are all up. Sadly, the opposite is also true. When one goes down, they all go down. That’s why most “diversified” portfolios were decimated in the 2008-2009 decline. It’s also why our portfolios lost only half as much. Are you willing to give up bragging rights at a cocktail party in order to see your portfolio increase more steadily? Willing to accept that you won’t “beat the market” (or at least one of its benchmarks) every year? Then you are ahead of the pack – way ahead. The relationship between various investments illustrated below makes all the difference between a few good years followed by a few disastrous years followed by a few good years followed by… well, you get the idea. If you truly want to get off that roller-coaster, you must pay attention to the long-term correlations among various asset classes. (click to enlarge) These correlations change over time, of course, and each year will likely be slightly different than the previous and the next. It’s the Big Picture that counts. That’s why I have selected an historical chart, this one from the website doughroller.com in an article by Rob Berger, “Are Correlation Coefficents Converging Among Previously Disparate Asset Classes?” wherein the author cites work by William J. Coaker II covering the 25 years from 1970-2004. To my point above, please note how tightly correlated, large growth, large value, mid growth, mid blend and mid value are correlated: the lowest value obtained was a 73% correlation between mid-cap growth and mid-cap value. On the other hand, adding an asset like real estate ETFs had only a 52% correlation with the S&P 500, global bonds a negative 0.3% and a long/short fund a negative 0.1%. This does not mean that if the S&P 500 is up 10% in a given year, that real estate would only be up 5.2%. Indeed it might mean real estate outperforms the S&P 500. The correlations between asset classes simply imply independence from each other. They are not a predictor of performance! We don’t care what the markets do on any given day. But if we discern the need to lighten up on our long exposure to large caps like the S&P 500, we would increase our holdings of asset classes poorly correlated with large caps, like global bonds, long/short Funds, and natural resources. If we just aren’t sure but our indicators tell us something is beginning to go amiss, we will typically at least move into more REITs and international stocks. What Might You Want to Consider Owning? Our research and analysis leads us to conclude that what follow are some of the best proxies for the asset classes we choose to diversify with. Your mileage may vary. Be sure to conduct your own due diligence and decide what works best for you. For us… US Large Caps are typically covered in most asset allocation portfolios by the SPDR S&P 500 ETF (SPY.) We are willing to seek niches within the asset class that may be more biased to equal weighting or more aggressive during times of market recovery, etc. For that reason our universe is considerably larger than SPY and includes ETFs like Schwab US Large-Cap Growth (SCHG,) iShares S&P 500 Growth (IVW,) Vanguard S&P 500 Growth (VOOG,) and Guggenheim S&P 500 Equal Weight. For a blend of US large cap growth and value, we’ll consider, among others, PowerShares S&P 500 High Quality (SPHQ,) Vanguard Russell 1000 (VONE,) and iShares Morningstar Large-Cap (JKD.) If we’re looking more on the value end of this spectrum, a couple we like are Wisdom Tree Dividend ex-Financials (NYSEARCA: DTN ) and PowerShares Dynamic Large Cap Value (PWV.) Among funds, we also use Smead Value Investor (SMVLX.) In the US Small / Mid Cap growth arena, we might prefer to look at iShares S&P Small-Cap 600 Growth (NYSEARCA: IJT ) or two of our favorite mutual funds, Aston/LMCG Small Cap Growth (MUTF: ACWDX ) or Akre Focus Retail (AKREX.) Among small cap blends, we like Guggenheim Spin-Off (CSD,) Schwab US Small-Cap (SCHA,) and mutuals Hodges Small Cap (MUTF: HDPSX ) and Mairs & Wasatch Strategic Income (WASIX.) For pure value, we lean toward WisdomTree SmallCap Dividend (NYSEARCA: DES ) and WisdomTree MidCap Dividend (DON.) In Real Estate, we like our choices of Schwab US REIT (NYSEARCA: SCHH ) and IQ US Real Estate Small Cap (NYSEARCA: ROOF ) more than the more-frequently selected Vanguard REIT (NYSEARCA: VNQ ) and SPDR Dow Jones REIT (RWR.) And we particularly like one fund, Baron Real Estate (BREFX.) Among International Large Cap alternatives, our favorites are all mutual funds: Artisan Global Equity (ARTHX,) Deutsche Global Infrastructure (TOLLX,) and Leuthold Global Industries (MUTF: LGINX ) are among our holdings. We also own some Deutsche X-trackers MSCI EAFE Hedged Equity (NYSEARCA: DBEF ) and WisdomTree Europe Hedged Equity ETF (HEDJ.) For International Small Caps, WisdomTree Europe Hedged Equity (NYSEARCA: DFE ) percolates to the top, with Tweedy Browne Global Value (MUTF: TBGVX ) a consistent top performer. Emerging Markets offers a plethora of ETFs. We prefer Schwab Emerging Markets Equity (NYSEARCA: SCHE ) to the better-known EEM and VWO, and would prefer funds like Driehaus Emerging Markets Small Cap (MUTF: DRESX ) and HSBC Frontier Markets (MUTF: HSFAX ) for the more difficult to research Emerging Markets small caps. We also sometimes rotate into our mix some sectors we believe might be better than straight capitalization-based asset class selection, a few long/short ETFs and mutual funds, US and foreign bonds and, for clients who will benefit most by them, municipal bonds and closed-end bond funds. At this point, our total bond allocation is smaller than normal. Why do we typically carry some of these positions even during the best of times for the S&P 500? Because slow and steady wins the race. I can think of no better way to end this discussion of our way of investing than with the timeless wisdom of Ecclesiastes 9:11… “The race is not to the swift or the battle to the strong, nor does food come to the wise or wealth to the brilliant or favor to the learned; but time and chance happen to them all.” As Registered Investment Advisors, we believe it is our responsibility to advise that we do not know your personal financial situation, so the information contained in this communiqué represents the opinions of the staff of Stanford Wealth Management, and should not be construed as personalized investment advice. Past performance is no guarantee of future results, rather an obvious statement but clearly too often unheeded judging by the number of investors who buy the current #1 mutual fund one year only to watch it plummet the following year. We encourage you to do your own due diligence on issues we discuss to see if they might be of value in your own investing. We take our responsibility to offer intelligent commentary seriously, but it should not be assumed that investing in any securities we are investing in will always be profitable. We do our best to get it right, and we “eat our own cooking,” but we could be wrong, hence our full disclosure as to whether we own or are buying the investments we write about.