Tag Archives: nasdaq

There’s Still Time To Lower Your Exposure To Riskier ETFs
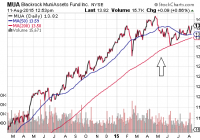
By itself, a “death cross” may not be particularly meaningful. However, when both the Dow Jones Industrials and the Dow Jones Transportation Average are flashing warning signs, stock valuations as well as risk preferences become increasingly important. As I have written previously, a tactical approach to asset allocation does not require that you abandon participation altogether. These tactical shifts will weather a hurricane, as well as permit me to raise risks at more attractive prices. A fair number of commenters, callers and perma-bulls were relatively tough on me in May when I suggested a strategic decision to raise cash levels . They were even tougher on me when I mentioned the possibility of picking up safer havens like intermediate treasuries via the i Shares 7-10 Year Treasury Bond ETF (NYSEARCA: IEF ) and intermediate-to-long duration municipal bonds via the BlackRock MuniAssets Fund (NYSE: MUA ). There’s no doubt about it… I was early on the call. Yet the idea behind raising cash as well as bolstering one’s allocation to investment grade securities (e.g., treasuries, munis, etc.) emanated from a well-reasoned interpretation of the data. At the corporate level, earnings growth had been waning, revenue had been contracting and non-financial companies had more leverage (37%) than they had back in 2007 (34%). At the macro-economic tier, wage increases had been flatlining, manufacturing had been crumbling and transporters in the iShares Transportation Average ETF (NYSEARCA: IYT ) had been dying a death by a thousand small cuts. Keep in mind, many had been dismissing the struggles of shippers, truckers, railways and airlines as irrelevant. After all, the big industrials were not tanking in the same manner as the big transporters. Until now. Industrial corporations – both in the Dow Jones Industrials average as well as the Industrial Select Sector SPDR ETF (NYSEARCA: XLI ) – have succumbed to the same technical pattern of weakness. Specifically, the shorter-term 50-day moving average has crossed over and below the longer-term 200-day trendline (a.k.a. “the death cross”). By itself, a “death cross” may not be particularly meaningful. However, when both the Dow Jones Industrials and the Dow Jones Transportation Average are flashing warning signs, stock valuations as well as risk preferences become increasingly important. Back in May and in June, valuations across nearly every metric of respectability had already reached the 2nd priciest in history (2nd only to the year 2000). Consider Buffett’s favorite indicator, market cap to GDP. As of this moment, the Wilshire Total Market Index market cap is roughly $21850 billion. That’s 123% of GDP. By this metric, the US stock market is only expected to annualize at about 0.3% with returns from dividends over the next decade. (See Market Cap To GDP chart below.) As I warned back in early June , investors would, at that time, need to monitor the market internals to gain perspective on risk-averse behavior. Risk-off behavior had not yet materialized completely. Here on August 11, the NYSE A/D Line’s 50-day trendline has not yet crossed over and below its 200-day moving average. It appears poised to make that transition. Yet equally concerning is the reality that the A/D Line itself had fallen below its 200-day for the first time since July of 2011 . Meanwhile, there have been a series of lower lows for the A/D Line since I first began highlighting market internals in May. Risk preferences – risk-taking versus risk-aversion – can be witnessed across a variety of measures and a variety of asset types. Indubitably, risk-aversion has the momentum, whether one is looking at recent relative performance of large-cap over small-cap, domestic over foreign, or investment grade credit over higher-yielding credit. Over the last two months, IEF has gained 3.1% whereas the iShares iBoxx $ High Yield Corporate Bond ETF (NYSEARCA: HYG ) has lost 1.7%. The demand for safety is trumping the risk of “junk.” One final sign that serves as a huge “yellow” caution: the S&P 500’s Advancing-Declining Volume Line (AD Volume Line). In essence, if the AD Volume Line is rising, there is significant strength behind advancing stocks. If it is falling, however, you have significant selling pressure behind the decliners. Right now, the S&P 500’s AD Volume Line isn’t just falling. Its 50-day moving average has fallen below its 200-day moving average for the first time since… yes, you guessed it… July 2011. By way of review, extreme valuations for equities have existed for the better part of a year. (Note: This can viewed a dozen ways at my “Don’t Party Like It’s 1999″ commentary.) Macro-economic weakness has been getting weaker, whether it is the lack of consumer spending, the breakdown in business spending, manufacturing woes, wholesale inventory buildups, export deceleration, slumping commodities, wage flatness and/or labor force participation. Micro-economic concerns may be summed up with earnings stagnation and the “revenue recession.” (Note: I discussed the “macro” and “micro” at great length at the end of July in “5 Reasons To Lower Your Allocation To Riskier Assets.” ) And market internals? Nearly every conceivable way that I’ve looked at them – from lack of breadth in equities, to missteps by leaders like Apple (NASDAQ: AAPL ) and Disney (NYSE: DIS ) to widening credit spreads to treasury demand – “risk-off” is garnering the limelight. As I have written previously, a tactical approach to asset allocation does not require that you abandon participation altogether. I have moved the bulk of my client base (over the last three months) from a 65% equity stake (e.g., domestic, foreign, large, small, etc.) and 35% income position (e.g., short, long, investment grade, higher yielding, etc.) to something that might resemble 55% stock (mostly large-cap domestic), 25% income (mostly investment grade) and 20% cash/cash equivalents. Cash today will reduce the adverse impact of significant price depreciation. The same can be said for larger domestic companies faring better in the storm than foreign companies or smaller corporations; similarly, investment grade should provide relief where higher-yield debt is likely to struggle alongside other riskier assets. In other words, these tactical shifts will weather a hurricane, as well as permit me to raise risks at more attractive prices. Additional evidence of market internals “rolling over” completely might encourage the use of other “risk-off” measures. For instance, 55% stock might be lowered to 40%, bolstering the overall cash stash to 35% (or one-third). Another possibility? Multi-asset stock hedging. My colleague and I created the FTSE Multi-Asset Stock Hedge Index (MASH) for those who wish to neutralize stock crises and stock bears without using leverage, options or shorting. Components of the index include ETFs like the PIMCO 25+ Year Zero Coupon U.S. Treasury Index ETF (NYSEARCA: ZROZ ), the PowerShares DB USD Bull ETF (NYSEARCA: UUP ), the CurrencyShares Swiss Franc Trust ETF (NYSEARCA: FXF ) and the iShares National AMT-Free Muni Bond ETF (NYSEARCA: MUB ). Click here for Gary’s latest podcast. Disclosure: Gary Gordon, MS, CFP is the president of Pacific Park Financial, Inc., a Registered Investment Adviser with the SEC. Gary Gordon, Pacific Park Financial, Inc, and/or its clients may hold positions in the ETFs, mutual funds, and/or any investment asset mentioned above. The commentary does not constitute individualized investment advice. The opinions offered herein are not personalized recommendations to buy, sell or hold securities. At times, issuers of exchange-traded products compensate Pacific Park Financial, Inc. or its subsidiaries for advertising at the ETF Expert web site. ETF Expert content is created independently of any advertising relationships.
EVX: Cash In Trash

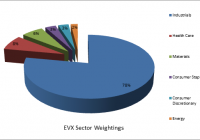
Proper waste management has been largely ignored by newly emerged economies. Legislation in advanced economies has necessitated the creation of a waste management industry. The Market Vectors ETF contains top-tier companies as well as very specialized waste management companies. Over the past twenty years or so, many nations discovered that socialist economic management, although noble in concept, was impractical in reality. Nations such as China, India, Russia, Eastern Europe and many South American nations pursued and adopted “free market principles” with great success. Literally millions upon millions have risen out of poverty and have attained a better standard of living. However, as so often happens in emerging markets, environmental sustainability took a back seat to economic development. The rapid industrial expansion may well have created a global “climate change”. It certainly has created dangerous levels of smog and air pollution in many of the world’s most famous cities. Several of the world’s great rivers have become polluted and nearly devoid of life. One critical problem that has hardly been addressed is the various kinds of solid waste; everything from industrial waste down to the trash generated, by each of us, every day. Van Eck Global offers investors a way to benefit from a niche market through its Market Vectors ETF Environmental Services ETF (NYSEARCA: EVX ) . The fund tracks the performance of the NYSE Arca Environmental Services Index (AXENV) : a modified equal dollar-weighted index intended to give investors exposure to the environmental services sector. A word of caution: This is a very thinly traded specialized fund so it may not be a suitable holding for all investors. However, it does contain well-known, well-established, dividend-paying companies. Hence, the questions are whether it’s worth holding the fund, or simply selecting individual companies. Since there are only 23 companies in the fund as of the first week of August 2015, it would be best to break the holdings down into their respective sectors and identify both strong and weak points. First, the fund is comprised almost entirely of US-based companies, 96.4%, and also a few Canadian holdings, 3.6%. This is an important point. Both governments have long established legislation on environmental issues, including the proper, safe and sustainable disposal of industrial and residential waste, for one example, the Ocean Dumping Ban Act of 1988 . Further, legislation is far from complete. Individual US states have their own requirements. The point being that there is a demand for the management of waste necessitated by laws and regulations. Further, laws, regulations, certifications, permits, specialized equipments and procedures are required to collect, transport and dispose of medical waste. A quick examination of the top ten holdings demonstrates the general waste management industry as well as the lesser-known specialized waste management companies. In fact, potential investors might even find the services offered as unique, interesting, and without a doubt critically necessary. Company and Symbol Percentage of Fund’s Holdings Recent TTM P/E Recent EPS Recent Dividend Yield Industry Specialization What They Do Waste Management (NYSE: WM ) 11.09% 23.36 $2.17 3.03% Industrial Provides waste management through local subsidiaries. Collects, transports, recycles: paper, glass, plastics, metal, electronics. Owns landfill and landfill gas-to-energy facilities. Republic Services (NYSE: RSG ) 10.99% 25.23 1.69 2.82% Industrial Similar to Waste Management, collecting, transporting and recycling non-hazardous residential, municipal and industrial solid waste. Waste Connections (NYSE: WCN ) 10.61% 26.89 1.85 1.05% Industrial and Minerals Diversified. Managing, collecting, transferring, disposing and recycling of municipal and residential wastes. Recycles paper, glass, metals and compostable waste, as well as non-hazardous natural resource exploration wastes. Stericycle (NASDAQ: SRCL ) 10.70% 40.91 3.49 0.00% Healthcare Services Provides consulting and regulated compliant solutions for healthcare and commercial businesses. Subsidiaries in the Americas, Europe, and the Pacific. Collections include “sharps”, pharma, blood, dental, used safety products and veterinary waste. Steris Corp. (NYSE: STE ) 3.88% 29.92 2.25 1.49% Healthcare Services Medical sterilization equipment and services. Disinfection systems, surgical tables, OR storage, scrub sinks; OR and GI procedure accessories; patient tracking; cleansing products. Some brand names: Amsco, Hamo, Cmax, Reliance and Harmony Tetra (NASDAQ: TTEK ) 3.77% 17.57 1.50 1.22% Materials and Energy Engineering and consulting services; water management and infrastructure, oil sands, geotechnical and Arctic engineering services. Operates in Canada as well as the US. Cantel Medical Corp. (NYSE: CMN ) 3.74% 49.40 1.09 0.19% Healthcare Services/Consumer Products Infection Prevention; GI equipment reprocessing, sterilants, detergents; disposable healthcare products; dialysis disinfection; biological packaging; and water purification. US, Canada and Puerto Rico. Progressive Waste Solutions (NYSE: BIN ) 3.69% 26.77 1.02 1.92% Industrial Municipal and residential waste management; landscape collection and recycling, recycling centers and landfill operations; portable toilets; waste audits and education/event services. Serves US, and Canada. ABM Industries (NYSE: ABM ) 3.68% 22.72 1.45 1.94% Industrial Provides integrated facilities solutions for commercial, government, institutions, hotel, airports, data centers, high-tech manufacturing. Commercial cleaning, maintenance and repair, HVAC maintenance, janitorial, security, parking management. US and Canada. US Ecology, Inc. (NASDAQ: ECOL ) 3.56% 35.22 1.38 1.48% Industrial/ Mineral Collection, transportation, treatment, disposal, recycling of hazardous, non-hazardous, and radioactive wastes. Chemical cleaning, decontamination, spill and emergency response. Operates in US and Canada. (Data from Van Eck and Reuters) Overall, 5 of all 21 holdings have a negative trailing twelve-month (TTM) EPS. The fund’s average EPS is positive at 0.96. The average TTM P/E is 25.5195 and the average dividend yield is 1.23%. The fund has a total of $15.6 million in total net assets. Its gross expense ratio is somewhat high at 0.92%, however, according to Van Eck, expenses for the fund are capped at 0.55% through January of 2016. As noted above, the fund is very thinly traded averaging 250 shares per day, over the past 30 days. The fund is currently trading at a slight premium to NAV of 0.03%. The share price was $62.51 as of the close on August 7, $0.03 over the NAV. The following table is a summary of the fund’s basic metrics: 1 Month 3 Months YTD 1 Year 3 Year 5 Year Since Inception 10/10/06 EVX -0.54 -1.1 -4.51 -2.32 9.82 8.67 6.45 EVX Shares -0.65 -1.55 -6.04 -4.37 9.67 8.57 6.41 AXENV Index -0.5 -1.01 -4.45 -2.16 10.29 9.20 6.99 (Data from Van Eck) Lastly, the fund pays a yearly dividend, as summarized in the table: (Data from Van Eck) A word or two needs to be said about a few of the holdings. For example, Newpark Resources (NYSE: NR ) , 2.01% of the holdings, is actually an oil and gas driller and only loosely connected to the management of resource waste management, per se. The company emphasizes its corporate responsibility to the environment as a provider of sustainable and ecologically-friendly drilling services in the industry. Needless to say, the company has been affected recently by overproduction in the oil and gas industry. Tenneco (NYSE: TEN ) , 3.00%, manufactures catalytic converters and diesel oxidation catalysts for combustion engines, thus indirectly managing carbon emission waste. Schnitzer Steel (NASDAQ: SCHN ) , 1.80%, specializes in large-scale metals shredding, blending and recycling to customer specifications, thus reducing landfill waste. Layne Christensen (NASDAQ: LAYN ), 1.86%, specializes in water management, drilling and construction. Darling Ingredients (NYSE: DAR ) , 3.03%, manufactures sustainable natural ingredients for edible and inedible bio-nutrients. These examples demonstrate that not every holding is a “pure-play”, which goes “out into the field”. They and others in the fund recycle or repurpose what would otherwise be an unusable waste product. However, all of the companies do relate to the central theme of hazardous and non-hazardous waste management: transportation, recycling, repurposing, filtration, disposal and also environmental consulting services. Since the sector has so few participants, it’s reasonable to consider the potential of competition and then pricing power. It’s reasonable, but not likely as EPA regulations require licensing, certification, inspection and needless to say accountability if something should go wrong. Thus, it would be difficult, expensive and time consuming for new entrants to establish themselves in this sector. On the other hand, an outright purchase of an established specialized waste management company would be far simpler. Recent headline-making events such as oil drilling accidents, freight train derailments causing chemical spills and fires requiring the evacuations of entire towns, coal wastewater ponds leaking into the water table, difficult or untreatable hospital infections, salmonella bacterial contamination in food production, contaminated HVAC cooling towers causing the often fatal Legionnaires’ disease, all indicate the growing need to fill a large niche for private sector investment. The Van Eck Market Vectors ETF is one of the few funds which specialize in environmental service. The companies in this fund are mostly profitable to the point of paying dividends. Once more, the lack of a market for the ETF shares will make this difficult to trade. But the fund will give a long-term investor with a little extra risk capital and patience, an opportunity to hold a diversified position in a growing industry, increasingly mandated by law and public demand. Disclosure: I/we have no positions in any stocks mentioned, and no plans to initiate any positions within the next 72 hours. (More…) I wrote this article myself, and it expresses my own opinions. I am not receiving compensation for it (other than from Seeking Alpha). I have no business relationship with any company whose stock is mentioned in this article. Additional disclosure: CFDs, spread betting and FX can result in losses exceeding your initial deposit. They are not suitable for everyone, so please ensure you understand the risks. Seek independent financial advice if necessary. Nothing in this article should be considered a personal recommendation. It does not account for your personal circumstances or appetite for risk.

Those Are Your Favorite Dividend Growth Funds? Try This One Instead

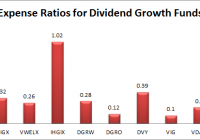
Summary SCHD feels like it doesn’t get much coverage in the dividend investing world, but it is one of the best ETFs in the space. SCHD offers the lowest expense ratio and the one of the better distribution yields. When I was browsing a list by Morningstar, I noticed they were not very interested in the expense ratios or the distribution yields. A few charts showing expense ratios and dividend yields may help you analyze which ones would make sense for you. It seems like the Schwab U.S. Dividend Equity ETF (NYSEARCA: SCHD ) is never in the news. That isn’t a bad thing, but is interesting when I look at some of the ETFs that are getting mentioned by big companies. I recently ran across an article on Morningstar that left me a little curious. The author, apparently speaking for Morningstar, was giving their take on “Our Favorite Dividend Growth Funds and ETFs.” She is a director of personal finance and the author of a book on how to succeed when investing in mutual funds . If anyone should understand the importance of low expense ratios and high distribution yields, she would have the background for it. Of course, I don’t know her and have no grudge, but I was hoping for higher quality when Morningstar decided to publish it. The article included the following funds: T. Rowe Price Dividend Growth Fund (MUTF: PRDGX ) Vanguard Dividend Growth Fund (MUTF: VDIGX ) Vanguard Wellington Fund (MUTF: VWELX ) Hartford Dividend and Growth Fund (MUTF: IHGIX ) WisdomTree U.S. Dividend Growth ETF (NASDAQ: DGRW ) iShares Core Dividend Growth ETF (NYSEARCA: DGRO ) iShares Select Dividend ETF (NYSEARCA: DVY ) Vanguard Dividend Appreciation ETF (NYSEARCA: VIG ) Vanguard Dividend Appreciation Index Fund (MUTF: VDAIX ) It did not include SCHD, which I think should have been one of the top contenders. Let’s talk about the things that actually matter when comparing ETFs with similar investing goals. Remember that this is a discussion of dividend funds, so allocations may be different but there should be quite a bit of overlap. Expense Ratios The expense ratios on an ETF (or mutual fund) are one of the very first things an investor should consider. When I’m considering funds for my portfolio a high expense ratio is pretty much an automatic rejection. When buying an ETF you are making the assumption that the market is reasonably efficient and that your best bet for limiting your risk and finding success is to diversify your investments. If you don’t believe that to at least some extent then there is no reason to invest in either unless it was a requirement of an attractive retirement plan. The point is simple. Expense ratios literally eat your investment. The only reason to pay the expense ratio rather than to buy the individual stocks is for the benefit of being able to buy them all at once with less work and fewer transaction charges. Some investors may be willing to pay a high premium to acquire the most talented that is running “the best” fund. However, the premise that an individual investor can determine which manager will be most successful without ever meeting the manager is absurd. I’m not a believer in the market being perfectly efficient. I cover small cap mREITs and the price movements I’ve seen have convinced me that the small cap companies in the sector are anything but indicative of an efficient market. That is precisely the reason I choose to focus so much of my analysis on a small corner of the market. When a market is small it is expected to have significantly more opportunities for superior analysis because there are fewer experts in the field searching for a market failure. How often were expense ratios mentioned? Only once in identifying one of the reasons VIG was a top choice. The actual expense ratios were not stated for any of the funds. Since those expense ratios matter, I built a chart to display them: As you might guess, I’m fairly partial to SCHD and VIG as my choices for the best dividend growth funds. Distribution Yield Even though the market regularly moves up, many investors find themselves significantly underperforming the S&P 500. One major reason that actual realized returns for investors frequently underperform the market (besides expense ratios) is that as a group investors are terrible at knowing when to buy and sell. If investors as a group regularly understood when to sell, the market would be absurdly stable and herd mentalities would be avoided. I’m not giving myself some kind of self-serving analyst credit there either. Analysts aren’t good at calling the bottom or the top of the markets either. When it comes to winning by market timing, the best solution is to not play the game. Focus on buying ETFs but not selling them. If an investor is simply using a buy and hold strategy for the core of their portfolio the worst they can do is buy at a market top. One of the reasons for using a dividend growth portfolio is that the investor can hopefully live off the dividends eventually. Being able to do that encourages them to avoid selling their shares when the market crashes. I don’t know when the next crash will happen, but I’m fairly confident that most of us will live to see it. The last thing I would want is to be selling off the portfolio during the crash. This is a human error. It is not something intrinsic to the stocks or the ETF that holds them. It is a human mistake that panic leads to a sell off. Being able to live off the dividends prevents that mistake. Living off the dividends requires a stronger distribution yield. The distribution yields were mentioned zero times in the article on Morningstar, but I think they are very important for encouraging good investor decisions. Here is a chart of the expense ratios: Conclusion SCHD has the lowest expense ratio and the second highest distribution ratio. How can anyone skip past SCHD when consider dividend growth ETF investments? On the other hand, IHGIX had a very high expense ratio (over 1%) and a low distribution yield. That does not automatically make it a terrible investment, but it would concern me and certainly deserves to be mentioned when the stock is being suggested as one of the “favorites” for the dividend growth space. When I looked at the prospectus I noticed there were some fairly hefty charges on buying into the fund as well including a very nice dealer commission. No thanks, IHGIX is clearly not for me. For the investors that want to pick a dividend growth ETF, it would be wise to start with determining precisely what you want out of the fund. I always start with low costs. That means a low expense ratios and a preference for free to trade. If you’re convinced that you can handle selling small amounts off to create your own dividend yield without buying into a full scale panic, then distribution yield won’t be as important. I don’t think that dividend stocks are inherently better, but I think many investors would benefit by being protected from themselves. Perhaps the question should be, if an investor does not find dividend growth stocks superior and does not mind selling off portions of their portfolio, why would they be searching for a dividend growth ETF in the first place? Disclosure: I/we have no positions in any stocks mentioned, but may initiate a long position in SCHD over the next 72 hours. (More…) I wrote this article myself, and it expresses my own opinions. I am not receiving compensation for it (other than from Seeking Alpha). I have no business relationship with any company whose stock is mentioned in this article. Additional disclosure: Information in this article represents the opinion of the analyst. All statements are represented as opinions, rather than facts, and should not be construed as advice to buy or sell a security. Ratings of “outperform” and “underperform” reflect the analyst’s estimation of a divergence between the market value for a security and the price that would be appropriate given the potential for risks and returns relative to other securities. The analyst does not know your particular objectives for returns or constraints upon investing. All investors are encouraged to do their own research before making any investment decision. Information is regularly obtained from Yahoo Finance, Google Finance, and SEC Database. If Yahoo, Google, or the SEC database contained faulty or old information it could be incorporated into my analysis.