Tag Archives: nasdaq
Q3 2015 Investment Style Ratings For ETFs And Mutual Funds
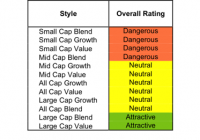
Summary Our style ratings are based on the aggregation of our fund ratings for every ETF and mutual fund in each style. The primary driver behind an Attractive fund rating is good portfolio management (stock picking) combined with low total annual costs. Cheap funds can dupe investors and investors should invest only in funds with good stocks and low fees. At the beginning of the third quarter of 2015, only the Large Cap Value and Large Cap Blend styles earn an Attractive-or-better rating. Our style ratings are based on the aggregation of our fund ratings for every ETF and mutual fund in each style. Investors looking for style funds that hold quality stocks should look no further than the Large Cap Value and Large Cap Blend styles. These styles house the most Attractive-or-better rated funds. Figures 4 through 7 provide more details. The primary driver behind an Attractive fund rating is good portfolio management , or good stock picking, with low total annual costs . Attractive-or-better ratings do not always correlate with Attractive-or-better total annual costs. This fact underscores that (1) cheap funds can dupe investors and (2) investors should invest only in funds with good stocks and low fees. See Figures 4 through 13 for a detailed breakdown of ratings distributions by investment style. All of our reports on the best & worst ETFs and mutual funds in every investment style are available here . You can see our investment style ratings for Q2’15 here . Figure 1: Ratings For All Investment Styles (click to enlarge) Source: New Constructs, LLC and company filings To earn an Attractive-or-better Predictive Rating, an ETF or mutual fund must have high-quality holdings and low costs. Only the top 30% of all ETFs and mutual funds earn our Attractive or better rating. The Schwab U.S. Dividend Equity ETF (NYSEARCA: SCHD ) is the top rated Large Cap Value fund and overall top rated style ETF. It gets our Very Attractive rating by allocating over 61% of its value to Attractive-or-better-rated stocks. Microsoft Corporation (NASDAQ: MSFT ), is one of our favorite stocks held by SCHD. Over the last decade, Microsoft’s after-tax profit ( NOPAT ) has grown by 13% compounded annually. The company currently earns a top-quintile return on invested capital ( ROIC ) of 48% and has generated positive free cash flow every year since 2002. Investors have failed to recognize Microsoft’s position as a cash-generating machine and the stock remains undervalued. At the current price of ~$47/share, Microsoft has a price to economic book value ( PEBV ) ratio of 1.1. This ratio implies that the market expects the company’s profits to only grow by 10%. However, if Microsoft can grow NOPAT by just 5% compounded annually for the next decade , the stock is worth $69/share – a 47% upside. Despite the slowing PC market, Microsoft should be able to surpass such low market expectations as they focus on monetizing their cloud services and software offerings. The Chartwell Small Cap Value Fund (MUTF: CWSVX ) is the worst rated Small Cap Blend fund. It gets our Very Dangerous rating by allocating over 62% of its value to Dangerous-or-worse-rated stocks. Making matters worse, it charges investors total annual costs of 5.22%. ESCO Technologies (NYSE: ESE ) is one of our least favorite stocks held by CWSVX. ESCO’s NOPAT has fallen by 8% compounded annually since 2011. The company earns a ROIC of only 6%, which is well below the 10% achieved in the mid 2000’s. While ESE is down 3% year to date, the stock price is still overvalued. To justify its current price of ~$38/share, ESCO must grow NOPAT by 14% compounded annually for the next 17 years . This expectation is very optimistic considering the business has not grown profits at all the past four years. Investors would be better off looking at quality stocks, such as Microsoft, and avoiding ESE. Figure 2 shows the distribution of our Predictive Ratings for all investment style ETFs and mutual funds. Figure 2: Distribution of ETFs & Mutual Funds (Assets and Count) by Predictive Rating (click to enlarge) Source: New Constructs, LLC and company filings Figure 3 offers additional details on the quality of the investment style funds. Note that the average total annual cost of Very Dangerous funds is more than three times that of Very Attractive funds. Figure 3: Predictive Rating Distribution Stats (click to enlarge) * Avg TAC = Weighted Average Total Annual Costs Source: New Constructs, LLC and company filings This table shows that only the best of the best funds get our Very Attractive Rating: they must hold good stocks AND have low costs. Investors deserve to have the best of both and we are here to give it to them. Ratings by Investment Style Figure 4 presents a mapping of Very Attractive funds by investment style. The chart shows the number of Very Attractive funds in each investment style and the percentage of assets in each style allocated to funds that are rated Very Attractive. Figure 4: Very Attractive ETFs & Mutual Funds by Investment Style (click to enlarge) Source: New Constructs, LLC and company filings Figure 5 presents the data charted in Figure 4. Figure 5: Very Attractive ETFs & Mutual Funds by Investment Style (click to enlarge) Source: New Constructs, LLC and company filings Figure 6 presents a mapping of Attractive funds by investment style. The chart shows the number of Attractive funds in each style and the percentage of assets allocated to Attractive-rated funds in each style. Figure 6: Attractive ETFs & Mutual Funds by Investment Style (click to enlarge) Source: New Constructs, LLC and company filings Figure 7 presents the data charted in Figure 6. Figure 7: Attractive ETFs & Mutual Funds by Investment Style (click to enlarge) Source: New Constructs, LLC and company filings Figure 8 presents a mapping of Neutral funds by investment style. The chart shows the number of Neutral funds in each investment style and the percentage of assets allocated to Neutral-rated funds in each style. Figure 8: Neutral ETFs & Mutual Funds by Investment Style (click to enlarge) Source: New Constructs, LLC and company filings Figure 9 presents the data charted in Figure 8. Figure 9: Neutral ETFs & Mutual Funds by Investment Style (click to enlarge) Source: New Constructs, LLC and company filings Figure 10 presents a mapping of Dangerous funds by fund style. The chart shows the number of Dangerous funds in each investment style and the percentage of assets allocated to Dangerous-rated funds in each style. The landscape of style ETFs and mutual funds is littered with Dangerous funds. Investors in Small Cap Blend have put over 73% of their assets in Dangerous-rated funds. Figure 10: Dangerous ETFs & Mutual Funds by Investment Style (click to enlarge) Source: New Constructs, LLC and company filings Figure 11 presents the data charted in Figure 10. Figure 11: Dangerous ETFs & Mutual Funds by Investment Style (click to enlarge) Source: New Constructs, LLC and company filings Figure 12 presents a mapping of Very Dangerous funds by fund style. The chart shows the number of Very Dangerous funds in each investment style and the percentage of assets in each style allocated to funds that are rated Very Dangerous. Figure 12: Very Dangerous ETFs & Mutual Funds by Investment Style (click to enlarge) Source: New Constructs, LLC and company filings Figure 13 presents the data charted in Figure 12. Figure 13: Very Dangerous ETFs & Mutual Funds by Investment Style (click to enlarge) Source: New Constructs, LLC and company filings D isclosure: David Trainer and Max Lee receive no compensation to write about any specific stock, sector or theme. Disclosure: I/we have no positions in any stocks mentioned, and no plans to initiate any positions within the next 72 hours. (More…) I wrote this article myself, and it expresses my own opinions. I am not receiving compensation for it. I have no business relationship with any company whose stock is mentioned in this article.
Views From The CIO: Three Reasons We (Still) Like The Healthcare Sector
By Mustafa Sagun, Chief Investment Officer, Principal Global Equities I am often asked the same question of why I (still) like healthcare so much. Since 2010, our global unconstrained portfolios have carried significantly larger weights to the healthcare sector than conventional cap-weighted indices. We believe the benefit of owning healthcare stocks is they can provide higher earnings growth, at attractive valuations, with diversification from highly correlated global growth-sensitive stocks. Here are three reasons why we believe healthcare has been a stock picker’s haven: 1. Stock-specific earnings growth that is independent of slowing global growth prospects or commodity prices. Some examples of healthcare companies and some recent earnings growth drivers include: Gilead Sciences (NASDAQ: GILD ) – growth of the Hepatitis C market Shire PLC (NASDAQ: SHPG ) – acceptance of the Attention Deficit Disorder drug in the market Novo Nordisk (NYSE: NVO ) – growth in easy-to-use Insulin injection sales in emerging markets Roche ( OTCQX:RHHBY ) – Multiple new drugs coming through their cancer pipeline. These companies’ earnings growth drivers are independent of each other, and more importantly, independent of the growth rate in China (or elsewhere) or the direction of oil prices (or other commodities). Many other cyclical stocks are more highly correlated. (click to enlarge) 2. Over the last three years, the U.S. healthcare provider industry has been going through a structural shift that will likely continue to drive earnings growth and profit margin expansion. Medical utilization rates are going up and costs are going down; the best of both worlds! Obamacare has resulted in more people being insured and hospitals being paid for the care of previously uninsured, non-paying patients. This is benefiting hospital operators, while keeping costs down for insurers since consumers have to control their expenses themselves. Also, the increased usage of generic drugs relative to branded is more profitable for distributor companies as the profit margins are higher for generics, and generic drug makers are seeing their sales volumes increase as well. Of course, more generic drugs keep the cost to consumers down too! Again, best of both worlds! 3. Biotechs provide optionality for high earnings growth with powerful new drug offerings. I am talking about profitable biotech companies; not the unprofitable, single-drug, small-caps that are highly risky. New generation drugs have multiplied since the mapping of human genome in 2003. For example, GILD offered the first drug to “cure” Hepatitis C in December of 2013 and has seen its quarterly earnings go from $0.55/share in the fourth quarter of 2013 to $3.15/share in the second quarter of 2015, a 473% increase. There are more innovative drugs coming in the pipeline to cure or treat diseases that we previously thought were untreatable. For investors to benefit, stock picking is key here (an ETF will not help.) Editor’s Note: This article discusses one or more securities that do not trade on a major U.S. exchange. Please be aware of the risks associated with these stocks.