Tag Archives: mutual funds

Wintergreen Takes An Evergreen Approach To Stock Selection

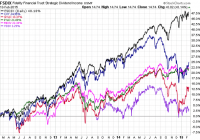
Summary WGRNX is a go anywhere fund with a current focus on Asia’s emerging middle class. Manager David Winters looks for companies showing a trifecta of strong management, improving situation and undervalued shares. The biggest drawback to the fund is the 1.85% expense ratio. Established in 2005, the two-star Morningstar rated Wintergreen Investor Fund (MUTF: WGRNX ) is a world stock category fund that seeks capital appreciation. The fund invests in stocks or convertible securities that manager David Winters believes are available at a discount to their intrinsic value. The fund invests in domestic and foreign issues of any size, including those from emerging markets. Investment Strategy Investment manager David Winters identifies securities through extensive analysis that includes book value, cash flow and earnings multiples. The goal is to select stocks that constitute what the fund manager calls a “trifecta.” These are stocks with good value issued by companies with shareholder-oriented management that are demonstrating improved business operations. The portfolio typically holds around 30 individual positions for the long-term while attempting to minimize turnover. This strategy often leads to owning shares in cash-rich companies that pay dividends or buy back shares. Shares are sold when valuation targets are met. The fund typically maintains 10 percent cash in order to capitalize on opportunities as they occur. WGRNX may invest in arbitrage opportunities that result from mergers, acquisitions, spin offs and consolidations as well as tender offers and liquidations. In addition to arbitrage opportunities, the fund may also take an activist role if the team anticipates that this position will benefit the investment. To minimize risk, the manager may engage in hedging strategies, such as owning gold and foreign currency swaps, purchasing put or call options and shorting stocks. Portfolio Composition The $1.5 billion fund held 14.91 percent of assets in cash as well as 33.01 percent in domestic stocks and 51.79 percent in foreign issues at the end of 2014. Mr. Winters believes that U.S. stocks are overvalued. As a result, the fund’s foreign stock and cash positions are higher relative to the category average and the domestic stock position is lower. The foreign issues have a slight tilt toward Developed Europe. The Asian share portion of the portfolio includes emerging and developed markets minus Japan. The portfolio has a market cap distribution on 55.95 percent giant, 34.49 percent large and 4.87 mid-cap stocks as well as a total 4.72 percent stake in small and micro-cap stocks. The fund is overweight consumer cyclical and consumer defensive stocks and underweight financials and healthcare. It does not hold any shares in the telecom or utility sectors. The fund’s aggressive and concentrated portfolio is a reflection of Mr. Winter’s belief that few companies meet Wintergreen’s stringent investment criteria. Only one category fund has a lower average debt/capital ratio and a higher average return on equity. The portfolio has a P/E ratio of 17.21, a price-to-book ratio of 2.70 and a dividend yield of 2.02 percent. Historical Performance and Risk WGRNX has beaten the MSCI World ex-USA Index since inception. Morningstar gives the fund a downside capture ratio of 57.22 percent over the past 5 years, and this performance reflects the fund’s resilience during down markets due to its preference for low-debt companies that have high relative cash positions. WGRNX has a low return rating from Morningstar. It has delivered 1-, 3- and 5-year total returns of 2.37 percent, 6.40 percent and 9.23 percent respectively. This compares to the index averages of 0.77 percent, 6.76 percent and 6.29 percent for the same periods. WGRNX has a below average risk rating from Morningstar as well as a three-year beta and standard deviation of 1.70 and 10.44. The category beta and standard deviation for the same period are 0.76 and 10.85. (click to enlarge) Fees and Expenses With a 1.85 percent total expense ratio, WGRNX is an expensive fund. This expense ratio is higher than 95 percent of funds in the no-load world stock category. The fund also has a 60-day redemption fee of 2 percent and a 12b-1 fee of 0.25 percent. Initial minimum investments are $10,000 for taxable accounts, $3,000 for an IRA and $2,000 for a Coverdell ESA. Fund Outlook WGRNX has a high quality portfolio and strong cash position that makes it well prepared for the next market correction. Winters also keeps turnover low at 12 percent of assets, but this buy-and-hold approach has cost it in the short-term. The fund remains focused on Asia with a concentration on consumer-oriented shares. Top 10 holdings Wynn Macau and Swiss timepiece manufacturer Swatch are plays on Asia’s emerging middle class, and the crackdown on corruption in China, as well as the ongoing economic slowdown there, weighed on results in 2014 as luxury sales declined. Another top 10 holding, Canadian Natural Resources (NYSE: CNQ ), has been battered by the plunge in oil prices. WGRNX should continue to be less volatile than other funds in the world stock fund category. Wintergreen’s continued focus on a sound investment strategy relative to strong business franchises with little debt and Mr. Winters’ conservative stock-picking acumen should enable WGRNX to sustain its strong relative performance in the long-term. A positive not captured in financial data is David Winters’ shareholder advocacy. He’s been a vocal critic of Coca-Cola (NYSE: KO ) management (see his recent interview on Fox Business ) over issues such as compensation and poor operating results. Investors in WGRNX are getting a manager who looks out for their interests all the way to the boardroom. The big stumbling block is the fees, which are too high at 1.85 percent of assets. Investors are starting each year nearly 2 percent behind the category and index, and performance hasn’t been consistently strong enough to justify those fees yet. Unfortunately, there aren’t similar portfolios out there. A fund such as Matthews Asian Growth and Income Fund (MUTF: MACSX ) offers exposure to Asia’s rising middle class, but it doesn’t offer the same exposure via blue chip multinationals offered by WGRNX. Some ETFs such as the iShares MSCI Emerging Markets Consumer Discretionary Sector Index ETF (NASDAQ: EMDI ) also tap into similar themes, but without an Asian focus. The Guggenheim China Small Cap ETF (NYSEARCA: HAO ) offers exposure to Chinese consumers, but only Chinese consumers. Investors can replicate some of the exposure in WGRNX with ETFs such as the iShares Global Consumer Staples ETF (NYSEARCA: KXI ) and the Market Vectors Gaming ETF (NYSEARCA: BJK ). Disclosure: The author has no positions in any stocks mentioned, and no plans to initiate any positions within the next 72 hours. (More…) The author wrote this article themselves, and it expresses their own opinions. The author is not receiving compensation for it (other than from Seeking Alpha). The author has no business relationship with any company whose stock is mentioned in this article.

Fidelity Strategic Dividend & Income Fund Gets Results

Summary FSDIX is a multi-asset fund that has held up very well versus newer multi-asset ETFs. FSDIX aims for capital appreciation in addition to income, so yield is relatively low at 2.34 percent. FSDIX is less volatile than the competition. The Fidelity Strategic Dividend & Income Fund (MUTF: FSDIX ) was established in December 2003. The fund offers investors a multi-asset approach to income, with five major asset classes included in the portfolio. A 2.34 percent yield puts the fund’s yield not far above that of the broader market, but it comes with wider diversification and lower volatility. Manager Outlook With over two decades of experience in the financial investment industry, Joanna Bewick has served as the portfolio’s lead manager since 2008. She is assisted by co-manager Ford O’Neil who has been with Fidelity since 1990. Both of them also manage the Fidelity Strategic Income Fund (MUTF: FSICX ). The fund’s default allocations are 50 percent common stock, 15 percent convertible securities, 15 percent in REITs or other real estate-related investments, and 20 percent preferred stocks. The lead managers believe the U.S. economy will continue to improve across the majority of economic sectors. They also see the economy as being in a mid-cycle expansion, which creates an expectation of moderate corporate earnings growth. The managers believe asset classes have a fair to slightly rich valuation. Although the quantitative easing program has ended, their expectation is that any interest rate adjustments by the Federal Reserve will be gradual and data dependent. Recent low inflation numbers provide the Fed with more leeway for keeping rates low in the near term. This creates a situation where domestic bond yields are more attractive than the returns of other sovereign bonds. While they predict that dividends and income are likely to play more of a role in total returns than capital appreciation, the increased volatility may create more investment opportunities. The result is a continued bias towards dividend paying stocks, which still comprise the largest portion of the fund, due to their current income and secondary potential for capital appreciation. The fund will also maintain a normal weighting of REITs on a risk-adjusted basis as long as the macroeconomic environment remains steady. While the fundamentals of this asset class remain strong and could produce significant returns, the weighting minimizes the impact of rising interest rates that could hamper returns. Managers believe that it may be difficult to find opportunities to deploy cash in the shrinking convertible securities market, which may cause an underweighting of this asset class. They also expect to remain underweight preferred stock until valuations become more advantageous. Managers will rebalance the fund based on market conditions. Asset Allocation and Security Selection The fund seeks to provide investors with reasonable current income with the potential for capital appreciation. With an investment strategy focused on equity securities that provide current income and have the potential for capital appreciation, the no-load fund tends to concentrate on value stocks. The portfolio invests in domestic and foreign issues. When building the portfolio, lead and sub-portfolio managers evaluate securities based on the macroeconomic environment, investor sentiment and fundamentals, as well as their current and historic valuations. The team manages risks and shift allocations based on a bull-or-bear case for each asset class. Over the past quarter ending December 2014, the fund continued to favor dividend paying equities. Veteran investor Scott Offen, who has been with Fidelity since 1985, manages the common stock sleeve. His focus is on mega-cap dividend paying stocks of companies with wide economic moats, with a portfolio yield 50 percent greater than the S&P 500 and lower volatility. In addition to boasting a 3 percent yield, a strong selection of individual securities in consumer discretionary, energy and industrials helped this sub-portfolio outpace the benchmark and boost the fund’s overall returns. Adam Kramer manages the fund’s preferred stock and convertibles sleeves. Through his acumen, the fund has held up better during recent stock market declines. While the yields on preferred shares were attractive, their long durations were considered a negative factor. The resulting underweighting proved advantageous as this sector underperformed the overall market. The main drag on results was the concentration in banks, healthcare and cable TV. Another modest advantage was Kramer’s underweighting of convertible securities as this asset class also underperformed. This decision was based upon the manager’s belief that good investment opportunities were more difficult to obtain as the overall number of available issues decline. Information technology and industrial securities generated the most drag on this sub-portfolio. Minimizing exposure to these two underperforming asset classes provided a modest advantage for the overall fund. Managed by Samuel Ward, the real estate-related sleeve held a neutral weighting of REITs. This position was a contributor to the fund’s overall performance as the sector had a tremendous run. The greatest contributors were the fund’s investments in apartment and office REITs, which outperformed relative to the benchmark index. While the managers believe that fundamentals remain strong, they remain vigilant on interest rates and the possible negative impact that rising interest rates could have on the sector. Portfolio Composition and Holdings As of December 2014, this four-star Morningstar rated fund has $4.82 billion in assets under management. Compared to its goal of a neutral mix, the fund is slightly overweight common stocks and preferred stocks, while being underweight convertibles. Individual holdings are concentrated in financials, information technology, healthcare and consumer staples. The fund is underweight telecommunications and materials. While 95.84 percent of holdings are domestic securities, the portfolio has a small exposure to Europe and Asia, as well as a slight exposure to emerging markets. The market capitalization of the portfolio is 52.48 percent giant, 23.75 percent large and 16.15 percent mid cap, as well as 6.52 percent small and 1.09 percent micro cap. The fund has a P/E ratio of 18.73 and a price-to-book ratio of 2.59. The fund’s top five holdings are securities issued by Exxon Mobil (NYSE: XOM ), Chevron (NYSE: CVX ), Proctor & Gamble (NYSE: PG ), Johnson & Johnson (NYSE: JNJ ) and IBM (NYSE: IBM ). These holdings comprise 11.85 percent of the total portfolio. Roughly 9 percent of assets are in fixed income, the specialty of lead and co-managers Bewick and O’Neil. The fixed income portion of the portfolio is concentrated in debt instruments rated BBB, BB and B, with a focus on maturities between three and seven years. The fund’s average duration is 3.91 years with a 30-day yield of 2.34 percent. Historical Performance and Risk Earning a high average return rating from Morningstar, FSDIX has delivered annualized returns of 14.48 percent, 13.85 percent and 13.87 percent over the past 1, 3 and 5 years, respectively. This compares to the category averages of 8.63 percent, 11.58 percent and 11.32 percent over the same periods. FSDIX has a low risk rating from Morningstar. The fund’s three-year beta and standard deviation of 0.98 and 6.64 compare favorably to the category ratings of 1.29 and 8.45. The SPDR Dividend ETF (NYSEARCA: SDY ) has a standard deviation of 9.26, making FSDIX less volatile than plain vanilla dividend funds. Fees, Expenses and Distributions The fund does not have any 12b-1, front-end or redemption fees. The low 0.74 percent expense ratio is below the category average of 0.92 percent. FSDIX supports automatic account builder and direct deposit functions. It has a minimum initial investment of $2,500 for both taxable and non-taxable accounts. Conclusion FSDIX is a multi-asset fund that offers a yield similar to a dividend ETF, but with lower volatility. Income growth hasn’t been great given the fact that certain asset classes, such as preferred shares, do not pay rising dividends. Shares fell 41 percent in 2008, so while they are less volatile, they aren’t without risk. However, some of those losses were excessive due to fears about bank solvency during the crisis, which hit preferred shares hard. In a more typical and milder bear market, the fund should hold up better than the broader market. FSDIX fund fills a niche for investors who want slightly higher income along with their capital appreciation, plus lower volatility. Investors who want to go the ETF route can check out some of the best multi-asset ETFs . FSDIX compares favorably to these funds thanks to a heavyweight towards equities and the fact that the equity heavy Guggenheim Multi-Asset Income ETF (NYSEARCA: CVY ) was stung by exposure to energy-related holdings. (click to enlarge) Disclosure: The author has no positions in any stocks mentioned, and no plans to initiate any positions within the next 72 hours. (More…) The author wrote this article themselves, and it expresses their own opinions. The author is not receiving compensation for it (other than from Seeking Alpha). The author has no business relationship with any company whose stock is mentioned in this article.

Investing For Retirement Using Northern Mutual Funds

Summary A set of just three Northern mutual funds, a bond, a large cap stock plus a mid cap fund generates good returns with relatively low risk. From January 2005 to January 2015, a Northern portfolio with fixed allocation could allow a safe 5% annual withdrawal rate with 1.36% increase of the capital. Same portfolio with rebalancing at 25% deviation from the target allowed a safe 5% annual withdrawal rate and 2.05% annual increase of the capital. Same portfolio with momentum-based adaptive allocation could have produced a safe 10% annual withdrawal rate and 1.26% annual increase of the capital. This article belongs to a series of articles dedicated for investing in various mutual fund families. In previous articles we reported our research on Fidelity , Vanguard , T Rowe Price , American Century , and Schwab mutual fund families. The current article does the same for Northern family of mutual funds. In addition, this article is the first in which a detailed study of the volatility of the returns using Sharpe and Sortino’s ratios is included. The series of these articles is aimed at a broad spectrum of investors. They may be useful to small individual investors as well as to any large institution managing retirement accounts. The general methodology we use in selecting the funds for the portfolio was presented in a previous article. The portfolio includes three funds: one bond fund and two equity funds. The equity funds are complementary: one covers large capitalization; the other fund contains medium capitalization stocks. The mutual funds selected for investment are the following: Northern us Treasury Index fund (MUTF: BTIAX ) Northern Stock Index fund (MUTF: NOSIX ) Northern Mid Cap Index fund (MUTF: NOMIX ) As in the previous articles, three different strategies are considered: (1) Fixed asset allocation. The portfolio is initially invested 50% in the bond fund and 50% equally divided between the two stock funds, without rebalancing. (2) Target asset allocation with rebalancing. The portfolio is initially invested 50% in the bond fund and 50% equally divided between the two stock funds and is rebalanced when the allocation to any fund deviates by 25% from its target. (3) Momentum-based adaptive asset allocation. The portfolio is at all times invested 100% in only one fund. The switching, if necessary, is done monthly at closing of the last trading day of the month. All money is invested in the fund with the highest return over the previous 3 months. The data for the study were downloaded from Yahoo Finance on the Historical Prices menu for three tickers: BTIAX, NOSIX, and NOMIX. We use the monthly price data from January 2005 to January 2015, adjusted for dividend payments. The paper is made up of two parts. In part I, we examine the performance of portfolios without any income withdrawal. In part II, we examine the performance of portfolios when income is extracted periodically from the accounts. Part I: Portfolios without withdrawals We report the performance of the portfolios under two scenarios: (1) no withdrawals are made during the time interval of the study, and (2) withdrawals at a fixed rate of the initial investment are made periodically. In table 1 we show the results of the portfolios managed for 10 years, from January 2005 to January 2015. Table 1. Portfolios without withdrawals 2005 – 2015. Strategy Total increase% CAGR% Number trades MaxDD% Fixed-no rebalance 93.45 6.82 0 -21.87 Target-25% rebalance 104.52 6.36 3 -31.09 Momentum-Adaptive 224.84 12.84 39 -13.35 In table 2 we show the results of a study on the volatility of the returns, including the much celebrated Sharpe and Sortino ratios. For completeness we give the definitions of these ratios. Sharpe ratio is the ratio of the compound annual growth rate (CAGR%) and the volatility of the returns (VOL%), where the volatility is defined as the annualized standard deviation of the returns. Sortino ratio is the ratio of the compound annual growth rate (CAGR%) and the volatility of the negative returns (NEG VOL%), where the volatility is defined as the annualized standard deviation of the negative returns. Table 2. Volatility performance of portfolios without withdrawals 2005 – 2015. Strategy CAGR% VOL% NEG VOL% Sharpe Sortino MaxDD% Fixed-no rebalance 6.82 7.18 6.29 0.95 1.08 -21.87 Target-25% rebalance 7.42 7.61 6.51 0.98 1.14 -31.09 Momentum-Adaptive 12.84 10.46 7.24 1.23 1.77 -13.35 By analyzing these results, one can see that the target portfolio has higher Sharpe and Sortino ratios than the fixed portfolio. On the other hand, the fixed portfolio has much lower maximum drawdown than the target portfolio. Which one is a better metric of risk: the volatility or the maximum drawdowns? Most investors, including the author of this article, are mostly concerned about large drawdowns, and pay less attention to Sharpe or Sortino ratios. The time evolution of the equity in the portfolios is shown in Figure 1. (click to enlarge) Figure 1. Equities of portfolios without withdrawals. Source: This chart is based on EXCEL calculations using the adjusted monthly closing share prices of securities. From figure 1 it is apparent that the rate of increase of the adaptive portfolio is substantially greater than the rate of the fixed and target allocation portfolios. Part II: Portfolios with withdrawals Assume that we invest $1,000,000 for income in retirement. We plan to withdraw monthly a fixed percentage of the initial investment. That amount is increased by 2% annually in order to account for inflation. In table 3 we show the results of the portfolios managed for 10 years, from January 2005 to January 2015. Money was withdrawn monthly at a 5% annual rate of the initial investment plus a 2% inflation adjustment. Over the 10 years from January 2005 to January 2015, a total of $535,920 was withdrawn. Table 3. Portfolios with 5% annual withdrawal rate 2005 – 2015. Strategy Total increase% CAGR% Number trades MaxDD% Fixed-no rebalance 14.51 1.36 0 -25.27 Target-25% rebalance 22.51 2.05 2 -26.77 Momentum-Adaptive 111.84 8.22 38 -16.56 The time evolution of the equity in the portfolios is shown in Figure 2. (click to enlarge) Figure 2. Equities of portfolios with 5% annual withdrawal rates. Source: This chart is based on EXCEL calculations using the adjusted monthly closing share prices of securities. To illustrate the advantage of the adaptive allocation strategy and the effect of withdrawal rates on the evolution of the capital, we give in Table 4 the results of simulations for the following withdrawal rates: 0%, 5%, 8%, and 10%. Table 4. Adaptive Portfolios with various annual withdrawal rates 2005 – 2015. Withdrawal rate % Total increase% CAGR% MaxDD% 0 224.84 12.84 -13.35 5 111.84 8.22 -13.97 8 52.33 4.53 -16.56 10 12.67 1.26 -20.25 The time evolution of the equity in the portfolios is shown in Figure 3. (click to enlarge) Figure 3. Equities of momentum-based portfolios with various annual withdrawal rates. Source: This chart is based on EXCEL calculations using the adjusted monthly closing share prices of securities. Conclusion The set of three Northern mutual funds, selected for this study, perform well for all three strategies and generate sustainable returns at relatively low drawdowns. Between 2005 and 2015, the fixed target allocation with rebalancing was able to sustain withdrawal rates of up to 5% annually. The adaptive allocation algorithm was able to sustain withdrawal rates up to 10% annually without any decrease of capital. Additional disclosure: This article is the sixth in a sequence on investing in mutual funds for retirement accounts. To help the reader compare the past performance of various mutual fund families, I selected a benchmark 10-year time interval starting on 1 January 2005 and ending on 31 December 2014. The article was written for educational purposes and should not be considered as specific investment advice. Disclosure: The author has no positions in any stocks mentioned, and no plans to initiate any positions within the next 72 hours. (More…) The author wrote this article themselves, and it expresses their own opinions. The author is not receiving compensation for it (other than from Seeking Alpha). The author has no business relationship with any company whose stock is mentioned in this article.