Tag Archives: management

5 Hedge Ideas To Protect Your Portfolio

PTT’s Yellow Alert immediately preceded the largest one-week market decline in years. PTT Research has sold most of its speculative and tertiary positions. PTT Research is keeping its Core positions. Suggestions on how and what to hedge in order to protect your portfolio. By Scott Moses Murray & Mark Gomes Recently, PTT Research Chief Analyst Mark Gomes issued a Stock Market Yellow Alert . These are fairly rare. We publish them when the market is frothy and excessively bullish or when it is showing signs of deterioration. The latter characterizes the market today. Paying subscribers received the alert on December 8th, one trading day after the S&P hit its all-time high. SPY has since fallen over 4%. Our last article discusses the conditions that prompted Mark to issue the alert. Today we will discuss ways to hedge your portfolio to protect against loss. According to the PTT Methodology , a Yellow Alert is a signal to go on the defensive. To do this, we keep the shares of official PTT picks and any other core holding we may have, but we protect ourselves by selling tertiary (non-important) holdings and putting hedges in place. To be clear, Mark does not recommend selling QAD Inc. ( QADA), Mattersight Corporation ( MATR), Glu Mobile (NASDAQ: GLUU ), JAKKS Pacific, Inc. ( JAKK), or Aero Grow International, Inc. ( AERO). He remains bullish on each of these businesses and believes their shares are undervalued, regardless of market action. In fact, he was a buyer of MATR and AERO as the market tumbled. Even during a correction, any of these companies might be acquired for a large premium over its share price today. The entire market, meanwhile, will not be acquired tomorrow for a large premium. When the market is at risk, we sell the market. We have conviction in our core positions, so we hold onto them. To protect our core positions when market risk is high, we put a full hedge in place. There are many ways to hedge. When you invest in PTT picks, you follow a strict Methodology. This is not exactly the case with hedging. It is more an art than a science. You have flexibility. It’s not so important how you hedge, but it is important that you hedge. To be fully hedged means for your hedges to have roughly the same beta-weighted value as your long positions. We won’t explain beta-weighting in depth because you can look it up easily enough, but here is a brief version. Each of your stocks has a beta, its measure of volatility relative to the indices on which it trades. If you want to fully hedge a long position, multiply its dollar value by the stock’s beta. The product of this multiplication is the dollar value you would short of the index ( IWM , QQQ etc.) to create a full beta-weighted hedge. Keep in mind that markets outside the US are also vulnerable. They make good hedges even if your stocks don’t trade there. With that in mind, here are some hedges you may want to consider. Short SPY, which tracks the S&P. If you are uncomfortable being a short-seller, buy HDGE , an ETF which shorts the market for you and goes up when the market goes down. Short EEM , which tracks emerging markets. Emerging markets typically depend on foreign investment, which flees to safety when the market looks unstable. Buy UUP , which tracks the US dollar. A beneficiary of flights to safety, the dollar tends to do well when markets fall. Short FXI , an ETF that tracks China. PTT subscribers are also shorting individual stocks that Mark’s research shows have fundamental reasons to decline regardless what the market does. A final word to the wise. This is not a Red Alert, but Mark believes conditions developing now may result in a fundamental breakdown in the market. He has issued only two Red Alerts in his career: one in 2000 and one in late 2007. A Yellow Alert is not a cause for panic. Three Yellow Alerts in 13 months imply that it is a time for caution, however. Mark plans to issue a number of market updates to PTT subscribers as events unfold, along with some picks that are Poised to Plummet-stocks that you can profit from by shorting. Visit us at www.pttresearch.com . Editor’s Note: This article covers one or more stocks trading at less than $1 per share and/or with less than a $100 million market cap. Please be aware of the risks associated with these stocks.
Is SCHC The Right ETF For International Exposure?

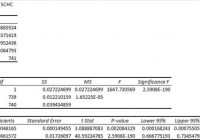
Summary I’m taking a look at SCHC as a candidate for inclusion in my ETF portfolio. The risk level is fairly acceptable for an international ETF. The ETF’s favorable risk profile is driven by the extremely diversified holdings and strong dividend yield. I’m not assessing any tax impacts. Investors should check their own situation for tax exposure. Investors should be seeking to improve their risk adjusted returns. I’m a big fan of using ETFs to achieve the risk adjusted returns relative to the portfolios that a normal investor can generate for themselves after trading costs. I’m working on building a new portfolio and I’m going to be analyzing several of the ETFs that I am considering for my personal portfolio. One of the funds that I’m considering is the Schwab International Small-Cap Equity ETF (NYSEARCA: SCHC ). I’ll be performing a substantial portion of my analysis along the lines of modern portfolio theory, so my goal is to find ways to minimize costs while achieving diversification to reduce my risk level. What does SCHC do? SCHC attempts to track the total return of FTSE Developed Small Cap ex-US Liquid Index. At least 90% of funds are invested in companies that are part of the index. SCHC falls under the category of “Foreign Small/Mid Blend”. Does SCHC provide diversification benefits to a portfolio? Each investor may hold a different portfolio, but I use (NYSEARCA: SPY ) as the basis for my analysis. I believe SPY, or another large cap U.S. fund with similar properties, represents the reasonable first step for many investors designing an ETF portfolio. Therefore, I start my diversification analysis by seeing how it works with SPY. I start with an ANOVA table: (click to enlarge) The correlation is about 69%, which is low enough to provide some solid diversification benefits so long as the ETF does not have an innately high level of risk. I measure risk with the standard deviation of daily returns. It isn’t perfect, but it works fairly well for my purposes and seems to hold up over time. Standard deviation of daily returns (dividend adjusted, measured since January 2012) The standard deviation is pretty good for foreign investments. For SCHC it is 0.8657%. For SPY, it is 0.7300% for the same period. Since SPY usually beats other ETFs in this regard, I’d look at that standard deviation level as being fairly favorable for an ETF that is competing for selection as a “Foreign Markets” ETF in my portfolio. Mixing it with SPY I also run comparison on the standard deviation of daily returns for the portfolio assuming that the portfolio is combined with the S&P 500. For research, I assume daily rebalancing because it dramatically simplifies the math. With a 50/50 weighting in a portfolio holding only SPY and SCHC, the standard deviation of daily returns across the entire portfolio is 0.7636%. Even in developed markets, I think 50% of a portfolio is way too high. When I drop the exposure to 20% in SCHC the standard deviation drops to .7342%. That’s a clear improvement, but I’d still like to see it a little lower. At 5%, the standard deviation is down to .7299% and diminishing returns are strongly in effect. Relative to other international investments, SCHC seems like a viable candidate for a larger position. I still wouldn’t consider going over 20%, but I think 5% to 10% is within reason. Why I use standard deviation of daily returns I don’t believe historical returns have predictive power for future returns, but I do believe historical values for standard deviations of returns relative to other ETFs have some predictive power on future risks and correlations. Yield & Taxes The distribution yield is 2.98%. The SEC 30 day yield is 2.11%. The ETF invests in foreign securities and I’m not a CPA or CFP. Investors concerned about tax consequences should seek advice from someone knowledgeable about their tax situation. If taxes are not a factor, the distribution yield is reasonable for producing income. Expense Ratio The ETF is posting .19% for an expense ratio. This is higher than the last few ETFs I have considered, but not high enough to stop me from considering it as a significant part of a portfolio. Market to NAV The ETF is trading right on NAV currently. However, premiums or discounts to NAV can change very quickly so investors should check prior to putting in an order. Largest Holdings The diversification within the ETF is excellent, as shown by the following chart: (click to enlarge) I don’t like including a significant position of U.S. dollars within an investment portfolio, but it is less than 2% and the portfolio of investments is phenomenally diversified. Since this ETF invests in smaller companies it is very important for the ETF to have extremely high levels of diversification. As long as the ETF trades near NAV, the ETF’s high level of diversification should continue to lead to relatively low levels of standard deviations. If there was a black swan even or investors soured heavily on international markets it could create an impact that would reach a large portion of the portfolio. Outside of those major events, the extreme diversification should help to stabilize the fund. Investing in the ETF is largely relying on modern portfolio theory. Making an investment requires a belief that markets are at least somewhat efficient so that the companies within the portfolio will be reasonably priced. Conclusion I’m currently screening a large volume of ETFs for my own portfolio. The portfolio I’m building is through Schwab, so I’m able to trade SCHC with no commissions. I have a strong preference for researching ETFs that are free to trade in my account, so most of my research will be on ETFs that fall under the “ETF OneSource” program. SCHC looks pretty good to me so far and is a leading candidate for inclusion in the portfolio.

Is SCHE Just Too Risky?

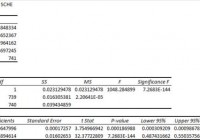
Summary I’m taking a look at SCHE as a candidate for inclusion in my ETF portfolio. The risk level is very high SCHE is the only ETF in the portfolio. I’m finding exposure over 5% to be too dangerous. The ETF has a solid dividend yield and extremely diversified holdings, but still needs to be combined with other ETFs. I’m not assessing any tax impacts. Investors should check their own situation for tax exposure. Investors should be seeking to improve their risk adjusted returns. I’m a big fan of using ETFs to achieve the risk adjusted returns relative to the portfolios that a normal investor can generate for themselves after trading costs. I’m working on building a new portfolio and I’m going to be analyzing several of the ETFs that I am considering for my personal portfolio. One of the funds that I’m considering is the Schwab Emerging Markets ETF (NYSEARCA: SCHE ). I’ll be performing a substantial portion of my analysis along the lines of modern portfolio theory, so my goal is to find ways to minimize costs while achieving diversification to reduce my risk level. What does SCHE do? SCHE attempts to track the total return of FTSE Emerging Index. The ETF falls under the category of “Diversified Emerging Markets”. Funds within this category usually invest at least 50% of their assets in developing nations. For SCHE specifically, the fund aims to invest at least 90% of the assets in stocks within the Emerging Index. The ETF is interested in large and middle cap companies. It is designed to avoid excessive exposure to individual industries. Does SCHE provide diversification benefits to a portfolio? Each investor may hold a different portfolio, but I use (NYSEARCA: SPY ) as the basis for my analysis. I believe SPY, or another large cap U.S. fund with similar properties, represents the reasonable first step for many investors designing an ETF portfolio. Therefore, I start my diversification analysis by seeing how it works with SPY. I start with an ANOVA table: (click to enlarge) The correlation is about 58.6%, which is extremely low for an equity investment. This low correlation bodes very well for the ETF when we start looking at risk adjusted returns. Standard deviation of daily returns (dividend adjusted, measured since January 2012) The standard deviation is bad. There’s no need to sugar coat it. The period I’m using has had relatively low volatility which causes most investments to show lower values for standard deviation. For the period I’ve chosen, the standard deviation of daily returns was 1.0774%. For SPY, it was 0.7300% over the same period. This makes SCHE one of the most volatile ETFs I have examined. Mixing it with SPY I also run comparison on the standard deviation of daily returns for the portfolio assuming that the portfolio is combined with the S&P 500. For research, I assume daily rebalancing because it dramatically simplifies the math. With a 50/50 weighting in a portfolio holding only SPY and SCHE, the standard deviation of daily returns across the entire portfolio is 0.8512%. However, in my opinion, putting 50% of a portfolio in emerging markets is speculative and resembles gambling more than investing. If the position in SPY is raised to 80% while SCHE is used at 20% the standard deviation of daily returns drops down to 0.7617%. In my opinion, the proper exposure here needs to be fairly low. Remember that as a portfolio becomes more diversified the variance of returns depends more on covariance among the assets rather than their individual variance. With 95% in SPY and 5% in SCHE the portfolio has a variance of 0.7356%. I think this is the highest exposure I would consider. Why I use standard deviation of daily returns I don’t believe historical returns have predictive power for future returns, but I do believe historical values for standard deviations of returns relative to other ETFs have some predictive power on future risks and correlations. Yield & Taxes The distribution yield is 2.44%. The SEC 30 day yield is 2.64%. Those yields aren’t bad and make this ETF look attractive as part of a dividend portfolio. However, the ETF invests in foreign securities and I’m not a CPA or CFP. Investors concerned about tax consequences should seek advice from someone knowledgeable about their tax situation. Expense Ratio The ETF is posting .14% for an expense ratio. This is low relative to many ETFs, though I prefer to see equity REITs with expense ratios under .10%. Market to NAV The ETF is trading at a .29% premium to NAV currently. That’s high enough to be a slight disincentive to investing, but not huge. This value can change very abruptly so investors should check it before placing an order. By the time this is published, that value will probably different. Largest Holdings The diversification within the ETF is good, as shown by the following chart: (click to enlarge) Only one position is over 2% and by the 6th company exposures are under 1.50%. That’s fairly solid diversification. If an investor is choosing to use ETFs, I would expect their goal to be the diversification benefits and low expense ratios. SCHE passes both of those tests. Investing in the ETF is largely relying on modern portfolio theory. The argument for the investment is the very low correlation of the portfolio to the major U.S. index funds. Making an investment requires a belief that markets are at least somewhat efficient so that the companies within the portfolio will be reasonably priced. Conclusion I’m currently screening a large volume of ETFs for my own portfolio. The portfolio I’m building is through Schwab, so I’m able to trade SCHE with no commissions. I have a strong preference for researching ETFs that are free to trade in my account, so most of my research will be on ETFs that fall under the “ETF OneSource” program. In my opinion, SCHE looks like a possible candidate for inclusion because of the low expense ratios and low correlation but the standard deviation of returns on the individual ETF were so high I am questioning whether I will stick to the 5% exposure I had initially planned or if I will lower it even farther. If I have to lower the exposure to something like 1%, it is hardly worth including because it is one more investment to track. For investors planning on investing more than $100,000 through ETFs the appeal of a 1% position increases. When I start compiling more complex portfolios, I will include SCHE in my tests. It’s a little on the risky side, but as long the position is 5% or less I think it will work.