Tag Archives: management

A New Biotech ETF Looks To Bring The Genomic Revolution To Investors
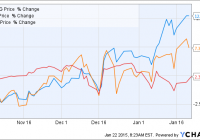
Summary The ARK Genomic Revolution Multi-Sector ETF launched last year with the goal of investing in companies that develop technologies related to extending and enhancing the quality of human life. The fund typically invests in about 40-50 names and is currently divided almost equally among all market capitalizations. The fund’s 0.95% expense ratio is currently the highest of the biotechnology ETFs. With biotechnology continuing to be the hot sector heading into 2015, we’ve seen several investment firms looking to capitalize on the trend. I’ve profiled a pair of those new biotech ETFs launched just recently here and here and another new one targeting a specific niche of the biotech universe began trading at the end of October of last year. The ARK Genomic Revolution Multi-Sector ETF (NYSEARCA: ARKG ) is from ARK Capital Management. Its primary investment objective according to the fund’s fact sheet is to identify securities that “are substantially focused on and are expected to substantially benefit from extending and enhancing the quality of human and other life by incorporating technological and scientific developments, improvements and advancements in genomics into their business. One such way this is accomplished is by offering new products or services that rely on genomic sequencing, analysis, synthesis or instrumentation.” This ETF typically invests in about 40-50 companies and isn’t necessarily looking for the next big diamond in the rough. According to the ARK Management website (which happens to update the holdings of this fund on a daily basis), the median market cap of one of its holdings is $5B. Illumina (NASDAQ: ILMN ) – the company that develops and manufactures tools for the analysis of gene sequencing – is the ETF’s current top holding but other big positions include popular names like Monsanto (NYSE: MON ), Biogen (NASDAQ: BIIB ) and even Qualcomm (NASDAQ: QCOM ). The fund doesn’t necessarily come cheap though. Its 1.45% expense ratio is currently the highest in the biotechnology ETF space easily outpacing the category average of 0.48% and the SPDR S&P 500 ETF (NYSEARCA: SPY ) ratio of just 0.09%. Management is currently capping the expense rate at its current management fee of 0.95% (administrative expenses of 0.50% are currently being waived although it’s still the highest in the sector). That’s not entirely unexpected as new funds establishing their portfolios for the first time tend to be more inefficient until the level of assets under management (currently at around $5M for this ETF currently) increases. Thanks to the continued popularity of biotechs the fund has gotten off to a fast start. Since its inception, the fund is up 13%. That’s well ahead of the iShares NASDAQ Biotechnology ETF (NASDAQ: IBB ) return of 7% and the S&P 500 return of 2%. ARKG data by YCharts Conclusion With biotechs in favor right now it’s not surprising to see niche ETFs like this popping up. The top holdings of this fund are actually fairly different from those of the Biotech Index ETF so it looks like there is some diversification potential here. The fund is off to a good start and the active management of the portfolio is a differentiator but it comes at a cost. The current expense ratio is a bit prohibitive and should be monitored to see if it comes in line with the sector average over time. Overall, investors looking for biotech exposure should consider this ETF for their portfolios. Now that you’ve read this, are you Bullish or Bearish on ? Bullish Bearish Sentiment on ( ) Thanks for sharing your thoughts. Why are you ? Submit & View Results Skip to results » Share this article with a colleague
InfraCap MLP ETF: Can An Actively Managed ETF Add Value To The Alerian MLP Index?

Summary The InfraCap MLP ETF is one of the new, actively managed ETFs, bringing return-enhancement strategies to the ETF space. MLP-focused funds face additional tax hurdles not faced by ETFs in other market sectors. The InfraCap fund strategies may help overcome those hurdles. The investment results from the new MLP can be directly compared to the largest MLP ETF, allowing investors to see if the active management strategies work. A new MLP-focused ETF, InfraCap MLP ETF (NYSEARCA: AMZA ) takes an interesting approach to offsetting the rather large hurdles facing an ETF that tracks the widely followed Alerian MLP Infrastructure Index – AMZI . Since AMZA is based on the index tracked by the largest MLP-focused ETF, results from the ETF can be directly compared. Challenges for an MLP ETF Several features of MLPs and the MLP indexes provide distinct challenges for an ETF that wants to mimic the returns of a specific ETF. These challenges result in significant underperformance by the ETF compared to the index or a well-selected basket of individual MLPs. Tax rules concerning investment funds and MLPs provide the biggest drag on returns. A fund that holds more than 25% of its portfolio in MLPs is forced to structure as a corporation and pay corporate income taxes on net income reported by the owned MLP units. A fund organized as a corporation will also adjust its calculated NAV for an accrued, deferred income tax liability. The result is an NAV that lags the index value gains by the 35% top corporate income tax rate. A second challenge for an Alerian index focused ETF is the structure of the AMZI index. The index includes just 25 midstream MLPs, with the five largest partnerships – Enterprise Products Partners, L.P. (NYSE: EPD ) , Magellan Midstream Partners, L.P. (NYSE: MMP ) , Plains All American Pipeline, L.P. (NYSE: PAA ) , Energy Transfer Partners, L.P. (NYSE: ETP ) , and MarkWest Energy Partners, L.P. (NYSE: MWE ) – accounting for 41% of the index value. The result is just a few large MLPs – good or bad – have an over-weighted impact on the index results. Benefits of an MLP Focused Fund Before jumping into the discussion about the AMZA ETF, here are a couple of reasons to use an MLP ETF as a way to get exposure to this historically high-yield, high-average total returns sector: A fund turns the MLP K-1 reporting tax hassle into a simple 1099 reporting investment. Typically, MLP fund dividends are a combination of non-taxable return of capital and ordinary income. A fund may be a better way to get MLP exposure inside of a tax-advantaged account such as an IRA. Owning MLP units inside of an IRA can produce additional tax reporting and tax payments out of the tax-deferred account. The corporate income tax accrual has the additional effect of increasing the yield of an ETF compared to the index. While the AMZI currently yields 5.74%, the tracking ETF yields 6.81%, even with 0.85% in expenses. InfraCap MLP ETF Active Management Adjustments to AMZI According to its prospectus , the InfraCap MLP ETF typically owns the same 25 midstream MLPs tracked by the AMZI index. However, the ETF’s active management strategy allows management to use any or all of the following strategies to boost returns or safeguard against declines. Underweight and overweight MLPs compared to the AMZI based on Infrastructure Capital Advisors proprietary model that values MLPs based on commodity prices, cash flow forecasts, and relative valuations. Fund management will sell call options to enhance the yield earned by investors. AMZA can employ up to 33.3% leverage. The use of leverage provides an offset to the corporate income tax bite. Management can reduce leverage or even move into cash if the model determines the MLP sector is overvalued. The bottom line is that with AMZA, investors get a strategically managed MLP ETF with an expense ratio of just 0.95%. This is significantly less than the typical expenses of an MLP-focused closed-end fund (which also incurs the corporate income tax bite) and the 0.85% expenses of the $9 billion in assets ALPS Alerian MLP ETF (NYSEARCA: AMLP ) . AMLP tracks the Alerian MLP Infrastructure Index. Since AMLP tracks the AMZI index and AMZA holds the same components weighted by its model, it will be interesting to see if the active management strategies produce extra return for investors. AMZA was launched in October 2014 and has gathered $7 million in assets. So we have two questions: Will the active management model work? And will investors buy into it?

SPDR S&P 500 ETF (SPY) Analysis: Using CapFlow And FROIC

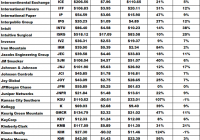
Summary Analysis of the components of the SPDR S&P 500 ETF (SPY) using my CapFlow and FROIC ratios. Specifically written to assist those Seeking Alpha readers who are using my free cash flow system. Part II will concentrate on “Main Street” while Part I in the series concentrated on “Wall Street”. Back in late December I introduced my free cash flow system here on Seeking Alpha, through a series of articles that you can view by going to my SA profile . My purpose in doing so was to try and teach as many investors as I could on how to do this simple analysis on their own as I believe in the following: “Give a person a fish and you feed them for a day, Teach a person to fish and you feed them for life” I have been very pleased with the positive feedback that I have received so far, but included in that feedback were many requests by those using my system, to see if they did their analysis correctly or not. Since the rate of these requests have been increasing with every new article I write, I have decided to start a new series of articles here on Seeking Alpha analyzing the SPDR S&P 500 ETF (NYSEARCA: SPY ), where I will analyze each of its components individually. That way those of you using my system will have something like a “teacher’s edition” that will give you all the correct calculations for each component. Obviously I can’t include the results for all my ratios in one article, so I will thus be doing a series of articles, where each ratio’s results for the SPDR S&P 500 ETF will have its own article devoted to it. Hopefully these articles can be used as reference guides that everyone can use over and over again, whenever the need arises. Having said that, I would suggest that everyone first read Part I by going HERE . There you will find the data on my “Free Cash Flow Yield” ratio which is one of three parts that I use it tabulating my final “Scorecard”. While free cash flow yield is a Wall Street ratio (Valuation Ratio), this article with concentrate on my “CapFlow” and “FROIC” Ratios, which are Main Street ratios. The final Scorecard results will be available in Part III of this series and basically combines all three ratio results to generate one final result. Once completed, my scorecard should give everyone a clearer understanding on how accurate the valuation is that Wall Street has assigned each company relative to its actual Main Street performance. Before we show you the final results of our two Main Street ratios, here is brief introduction to what each of the two ratios, which make up my system as well as what the final “Scorecard” score mean. CapFlow CapFlow is the name I have given to the ratio (Capital Expenditures/Cash Flow). CapFlow allows us to see how much capital spending (or capital expenditures, CAPEX) a company must employ in relation to its cash flow to maintain itself and more importantly grow the company. This ratio is extremely useful as it is both a qualitative and quantitative ratio in that it acts as a laser beam into the inner workings of a company. Quite simply if a company is increasing its profits and doing so by spending less money relative to its growth in cash flow, it should, in theory, outperform on Main Street. When you can have such an occurrence for more than a few years in a row, it clearly shows you have wonderful management in place that knows what it is doing. The ideal again is to consistently have a CapFlow of less than 33% and avoid any company, like the plague, that has a CapFlow of over 100%, as in such a case management is spending more in capital expenditures than it is bringing in from cash flow from operations. That is a recipe for disaster in my opinion. Just using this ratio alone will narrow your list of potential candidates for investment substantially and will give you an easy-to-use tool for judging management effectiveness. FROIC FROIC = Free Cash Flow Return on Invested Capital FROIC= Free cash flow/ (long-term debt + shareholders equity) FROIC basically tells us how much return in free cash flow a company generates for every one dollar of “Total Capital” it employs. I consider FROIC the primary determining factor in identifying growth companies as one can compare every company on an equal basis using this ratio. The question I ask every company I analyze is: “How much return (in percent) in free cash flow are you going to give us for every dollar of total capital you invest?” A FROIC of 20% or more is considered excellent and the higher the result the better. Since long-term debt is included in the invested capital part of the equation, one can see quite clearly by using this ratio, on just how well or how poorly management is managing its debt. So without further ado here are my results for the CapFlow and FROIC ratios for the components that make up the SPDR S&P 500 ETF : Always remember that the results shown above are just for two ratios and that this is not investment advice, but just the results of the ratios. The system outlined in this article and all that will follow, as part of this series, are just meant to be used as reference material to be included as just “one” part of everyone’s own due diligence. So in other words, don’t make investment decisions based on just these two results, but incorporate them as part of your own due diligence.