Can Energy ETFs Regain Fervor On Capital Spending Cuts?
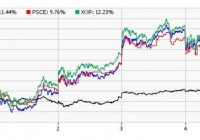
After a seven-month wild run, oil and energy stocks have bounced back strongly in recent sessions following the slew of capital spending cuts by several major players in the industry. This move, along with the latest data that a number of U.S. oil drilling rigs fell the most in 30 years last week, propelled the oil prices higher. In fact, both the crude and Brent surged about 20% in the four days till Tuesday, marking the longest winning streak since January 2009. However, oil price again reversed its four-session rally, dropping 8.7% yesterday after U.S. crude inventories jumped to a record high last week. Notably, crude is currently hovering around $50 per barrel while Brent is trading at over $55 per barrel. Spending Cuts at a Glance A large number of firms whether domestic or international have slashed their capital spending for this year in order to conserve cash balance for dividend payments. The second largest U.S. oil giant Chevron (NYSE: CVX ) trimmed its capital spending by 13% to $35 billion for this year while ConocoPhillips (NYSE: COP ) cut its spending by an additional 15% after reducing it 20% in December. Occidental Petroleum (NYSE: OXY ) reduced its capital spending by 33% to $5.8 billion for this year. European oil majors also followed suit. BP plc (NYSE: BP ) announced spending cuts by 20% to $20 billion for this year from the previous guidance of $25 billion. Royal Dutch Shell (NYSE: RDS.A ) plans to cut capital spending by $15 billion over the next three years while Total SA (NYSE: TOT ) trimmed its capital expenditure by 10% for this year. Further, the Chinese oil major CNOOC (NYSE: CEO ) slashed its capital spending by as much as 35% for this year and Russian oil major Gazprom ( OTCQX:GZPFY ) reduced it by $8 billion. Brazilian state-run energy giant Petroleo Brasileiro S.A. (NYSE: PBR ) or Petrobras also lowered its capital expenditure budget to $31-$33 billion from $44 billion. The efforts taken by these oil giants will likely curb oil production and reduce global supply, and thereby lead to higher oil prices. Market Impact Driven by a slew of investment cut plans, energy stocks and ETFs have made an impressive comeback and are easily crushing the overall market by wide margins over the past five days. In particular, SPDR S&P Oil & Gas Exploration & Production ETF (NYSEARCA: XOP ) , First Trust ISE-Revere Natural Gas Index Fund (NYSEARCA: FCG ) and PowerShares S&P SmallCap Energy Fund (NASDAQ: PSCE ) gained the most surging in double digits in the same period. Below we profile these ETFs in detail and discuss some of the specifics behind their recent rally: XOP This fund provides equal weight exposure to 83 firms by tracking the S&P Oil & Gas Exploration & Production Select Industry Index. Each holding makes up for less than 2.2% of the total assets. XOP is one of the largest and popular funds in the energy space with AUM of $1.9 billion and expense ratio of 0.35%. It trades in heavy volume of more than 10.4 million shares a day on average. FCG This fund offers exposure to the U.S. stocks that derive a substantial portion of their revenues from the exploration and production of natural gas. It follows the ISE-REVERE Natural Gas Index and holds 28 stocks in its basket that are well spread out across each component with none holding more than 6.05% of the assets. The fund has amassed $272.7 million in its asset base while charging 60 bps in annual fees. Volume is good with more than 942,000 shares exchanged per day on average. PSCE This fund provides exposure to the energy sector of the U.S. small cap segment by tracking the S&P Small Cap 600 Capped Energy Index. Holding 35 securities in its basket, it is concentrated on the top five firms that make up for 37.9% share. Other firms hold less than 5.4% of total assets. The fund is less popular and less liquid with AUM of $28.6 million and average daily volume of about 24,000 shares. Expense ratio came in at 0.29%. Other energy ETFs were also in deep green over the past five trading sessions. Some of these include IQ Global Oil Small Cap ETF (NYSEARCA: IOIL ) , First Trust Energy AlphaDEX (NYSEARCA: FXN ) , Market Vectors Unconventional Oil & Gas ETF (NYSEARCA: FRAK ) and PowerShares Dynamic Energy Exploration & Production ETF (NYSEARCA: PXE ) . All these are up in upper single digits. What’s In Store? The rally in the energy ETFs seems to be short lived as reduced investments will likely cut supply in the long term and short-term supply with remain intact. As per the latest EIA report, the U.S. crude stockpiles rose 6.3 million barrels in the week (ended January 30), much higher than the market expectation of a 3.7 million barrel increase. Total inventory came to 413.1 million barrels, representing the highest level in at least 80 years. The current threat facing the U.S. oil industry is the strike in the U.S. at nine refineries by the United Steelworkers union. This is the biggest strike since 1980 and will likely curtail crude processing adding to the supply glut. It could affect 10% of the U.S. refining capacity and if the strike turns to be a full-blown crisis, it could threaten about two-thirds of the total refining capacity, indicating more pain for the commodity and the energy stocks.