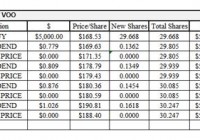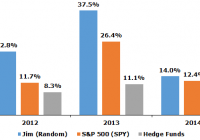
Summary In any large group of investors, some are bound to have outperformed simply by pure chance – it does not prove that they are skilled. The fact that even children and pets can outperform professional fund managers proves that luck is what mainly drives investment results. Even buying stocks you understand, as advocated by Warren Buffett, does not lead to superior investment performance. Stocks selected at random perform just as well – and often times even better – than stocks carefully selected by the so-called “experts.”. The common wisdom is that the more time one spends researching stocks, the better one’s investment results will be. But if this was true, then why do actively managed funds consistently underperform the market? Many of these funds spend enormous resources on research in an attempt to uncover the best stocks, and yet their performance is often surpassed by blindfolded monkeys throwing darts at a stock board. How can this be? How much of a role does luck play in investment success? This article will attempt to answer these important questions. Everyone is Above Average in their Own Minds Overconfidence refers to the human tendency to overestimate one’s own abilities and knowledge relative to others. This is sometimes called the “Lake Wobegon Effect” – a fictional town where all the women are strong, all the men are good looking, and all the children are above average. In the real world, for instance, 84% of Frenchmen feel that their lovemaking abilities put them in the top half of French lovers. And in the U.S., 93% of people believe their driving skills put them in the top 50% of U.S. drivers (although it does make me curious about how bad the last 7% of drivers are – they are probably dead by now). To see how prevalent the Lake Wobegon Effect (i.e., overconfidence) was in the financial markets, I once conducted a survey asking professional traders at a large, proprietary trading firm to rank their trading skills as either “below” or “above” average compared to their peers at the firm. Out of the 87 participants, 84 rated themselves as above average. This, of course, is a mathematical impossibility since only half of them, not 97%, can be better than average. Curiously enough, though, many of these “above average” traders ended up blowing up during the 2008 financial crisis. Their overconfidence led to massive risk-taking, which caused their eventual downfall. But in addition to irrational risk taking, overconfidence also leads to excessive trading. There are two major problems with overtrading: the first, and the most obvious problem, is that it increases taxes and trading fees; and second, the shares that individual traders sell, on average, do better than those they buy, by a very substantial margin. Essentially, this means that less really is more when it comes to trading. This is why the best predictor of future performance is the level of turnover, not pursuit of specific investment styles/philosophies. Perhaps Winnie-the-Pooh put it best when he said “Never underestimate the value of doing nothing.” More people should heed this advice. Luck is More Important than Skill (in Investing) Not only does overconfidence led to excessive trading and risk taking, it also makes people blind to the fact that investing – like casino gambling – is largely a game of luck. This is why past investment track records are less relevant than what most people think. Since there are literally tens of millions of investors in the world, it is a statistical certainty that a very tiny percentage of them will become a Warren Buffett or a George Soros. Likewise, if there were an equal number of coin-flippers, a few would, by pure chance alone, flip heads 20 or more times in a row – it does not prove that they are skilled coin-flippers. Because luck is what mostly determines success, the type of investment style/philosophy employed (e.g., value, growth, momentum, etc.) is of little importance. Buffett’s approach, for instance, is to buy undervalued stocks and wait for them to appreciate to fair value; conversely, Soros does not pay too much attention to valuation – he is famous for making some of his largest trading decisions based on nothing more than how much his back is hurting that day. Although using completely opposite investment approaches, both Buffett and Soros were still able to amass huge fortunes. This shows that, with luck on one’s side, literally any investment strategy can work. In fact, even random stock selection – like a blindfolded monkey throwing darts at a stock board – gives one as good a chance at beating the market as any other strategy. Interestingly enough, most of the time the monkeys actually perform better than the so-called “professionals,” probably because they have lower turnover and charge lower fees (bananas are pretty cheap). A few years ago, I began conducting a random stock picking experiment. I enlisted the help of my trusty five-year old sidekick Jimmy (or Jim as he prefers to be called). Jim was tasked with pulling 10 slips of paper at random out of a hat. Every slip of paper in the hat had a ticker symbol on it – there were 500 slips in total (each representing one company in the S&P 500 index). I then created a portfolio that is equally invested in those 10 companies, and tracked their performance over the course of a year. This experiment was conducted for three consecutive years (2012-2014), with the results show below. Exhibit 1: Random Stock Selection Outperforms Most Hedge Funds Note: (1) Jim picked a new set of stocks at the start of every year, which means his portfolio was completely rebalanced once per year. (2) The performance returns exclude dividends paid. Source: A North Investments, State Street Global Advisors, Barclay Hedge Fund Index The performance was impressive to say the least. Jim’s random stock picks significantly outperformed both the SPDR S&P 500 ETF (NYSEARCA: SPY ) as well as the average hedge fund for three consecutive years. But Jim’s outperformance is not surprising or unique – even non-humans can do it! Back in 2012, a ginger cat named Orlando had managed to outperform many fund managers. The cat simply selected stocks by throwing his favorite toy mouse on a grid of numbers allocated to different companies. In another funny example, a Russian circus chimpanzee named Lusha picked stocks that tripled in value over a year’s time. Lusha was presented with cubes representing 30 different stocks and selected eight to invest money in by picking the cubes. Her chosen portfolio outperformed 94% of Russian investment funds! The undeniable fact that children and pets can outperform professional fund managers proves beyond a shadow of a doubt that luck is what mainly drives investment results. If investing truly did involve skill, then the professionals would consistently outperform – just like we can expect a world-class chess grandmaster to consistently beat even the luckiest amateur chess player. Rather than seeking expert advice, then, most people are better off investing their savings by selecting stocks at random or by buying into an index fund or ETF which tracks a reputable selection of securities. Not only does this reduce long term risk, it also saves paying fees to fund managers with seven-figure salaries and hefty bonuses. For those who are interested (or perhaps have no children or pets to help them pick stocks), below I have provided a list of Jim’s random stock picks for 2015. I am willing to bet that little Jim’s portfolio will once again outperform the average high-fee-charging hedge fund! Exhibit 2: Jim’s Random Stock Picks for 2015 Source: A North Investments The Futility of Equity Research One of Buffett’s personal investing rules (right after “never lose money”) is to only buy companies you understand. This sounds like a very reasonable rule in theory. But as Yogi Berra once said, “In theory there is no difference between theory and practice; in practice there is.” In a way, Buffett seems to believe that having more knowledge about a company makes it easier to predict how much its intrinsic value (and its stock price) will change over time. This simply does not appear to be the case. Take, for instance, Google (NASDAQ: GOOG ) (NASDAQ: GOOGL ) founders Larry Page and Sergey Brin. Several years before Google’s massive IPO that made them both billionaires, they attempted to sell the whole company for a paltry $1.6 million. Luckily for them, no one in Silicon Valley was interested in buying the young company with its unique search technology. It can easily be said that nobody in the world possessed more knowledge about Google than its two founders, and even they could not predict the Google phenomenon (as the attempt to sell proves). It would then be foolish to believe that it is possible to make any better predictions about companies’ futures just by reading their old SEC filings. This explains why actively managed funds, even after spending millions of dollars and thousands of man-hours every year conducting detailed research in a futile attempt to find the best stocks, consistently underperform passive index funds and dart-throwing monkeys. As it is so often said, the definition of insanity is doing the same thing over and over and over again and expecting different results. That pretty well describes the actively managed fund industry. But what about small individual investors? There is a long-held belief that smaller investors have an advantage over the Wall Street crowd, since they are not subject to institutional constraints. Chief among these is the freedom to invest in small, thinly traded stocks, which research has shown tend to have higher returns than their larger counterparts. Still, I would argue that the future price behavior of each individual stock, regardless of size, always remains completely random and unpredictable – essentially making it impossible to consistently pick the best ones. In other words, smaller investors possess no advantage at all. To prove this empirically, I simply tracked the performance of every Seeking Alpha “Pro Top Idea” published during January 2014 (only the “long” recommendations). Not only are all of these relatively small companies, but they were specifically picked by the experts as the best stock ideas with the most near-term upside potential. These stock recommendations, 40 in total, were combined into an equally weighted portfolio, and the portfolio’s overall performance was tracked over the course of the year. The end results were even worse than expected. As shown below, the Pro Top Ideas even underperformed hedge funds, generating a negative return of 1.8% in 2014. Every single one of these 40 recommendations is extensively researched, well-written, and sounds very convincing, and yet these expert stock picks were easily outperformed by a child picking stocks at random out of a hat. To be fair, a small number of Pro Top Ideas did generate impressive 30%+ returns; however, any set of 40 randomly selected stocks will also contain a few that will provide similar returns, there is no need to waste time conducting research on them. Exhibit 3: Professional Stock Pickers Underperform Note: (1) Performance tracked from January 2, 2014 (the first trading day) to December 31, 2014 (the last trading day). (2) Only the “long” Pro Top Ideas were included; companies that were acquired during the year were excluded. Source: A North Investments, State Street Global Advisors, Barclay Hedge Fund Index, Seeking Alpha The main point is that no amount of research will make someone a better stock picker. It might sound counterintuitive, but the empirical evidence is overwhelmingly in support of this conclusion. This is because the price behavior of stocks is influenced by an infinite number of variables (most of them unknown), so attempting to predict which stocks will perform the best at any given time is impossible. It should also be noted that high subjective confidence (e.g., “high conviction stock picks” made by some suit-and-tie-wearing investment guru) is not to be trusted as an indicator of accuracy; if anything, low confidence could be more informative. Summary and Conclusion In any large group of investors, some are bound to have outperformed by pure chance alone – it does not prove that they possess skill. In other words, luck is what separates good investors from bad ones. But since luck has a tendency to revert to the mean in the long run, investing with a hotshot fund manager could be hazardous to one’s wealth. For this reason, most people are far better off investing their savings by selecting stock at random or by buying into a low-cost index fund or ETF which tracks a reputable selection of securities. This reduces risk and over time will produce higher after-tax returns. Disclosure: The author has no positions in any stocks mentioned, and no plans to initiate any positions within the next 72 hours. (More…) The author wrote this article themselves, and it expresses their own opinions. The author is not receiving compensation for it (other than from Seeking Alpha). The author has no business relationship with any company whose stock is mentioned in this article.