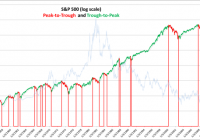
Summary Peak-to-trough drawdown periods represent approximately 27% of calendar days since 1950. Avoiding peak-to-trough drawdowns would have increased your returns by a factor of 2.12. Being short the market during drawdowns would have increased this to 3.23. Using up-capture and down-capture ratios are the best way to evaluate the effectiveness of market timing strategies. To successfully time the market, it’s best to have a quantitative system based on macroeconomic and fundamental variables, that is tested over many cycles and different interest rate regimes. Even good market timing strategies will underperform during bull markets and the amount of underperformance can be viewed as an insurance premium. By the numbers We first plot the peaks and troughs for the S&P 500. To be included as a peak or trough, the S&P 500 had to be equal to either its one-year high or one-year low to qualify. The S&P 500 had sixteen significant drawdown periods in the sixty four years from 1950 through 2014. This equates to a significant drawdown, on average, every four years. (click to enlarge) The 10-year constant treasury yield is shown in the background, scaled on the right hand side of the graph. Eleven drawdowns occurred in a rising interest rate environment and five in a declining rate environment. There were more frequent drawdowns in a rising rate environment, but the size of the drawdowns was more severe in the declining rate environment. The following table shows the returns for the sixteen peak-to-trough drawdown periods and trough-to-peak periods. The average drawdown was -26.3% and lasted 382 calendar days. The average trough-to-peak up return was 91.16% and lasted 1039 days. Peak-to-trough drawdown periods represent 27% of the calendar days. Note that these returns are based on daily closing prices and do not include dividends. The compound annual return excluding dividends for the 64 years was 7.76%. The next table shows a slightly different way of looking at the data that provides more granular detail, based on trading days, and provides an easy way to understand where the returns come from. It also avoids the distortion that comes from comparing equity curves that are dependent on start and end dates. The sum of the daily returns (yellow circle) for the 64 years is 482.16%, which equates to an average annual return of 7.53% – very similar to the compound return of 7.76% in the table above. The 482.16% was obtained by capturing 1020.25% in the trough-to-peak up-cycle and by giving up 538.09% in the peak-to-trough downturns. The second part of the table shows the detail for each of the 16 drawdown periods. Some highlights from this table: Drawdowns occur less frequently but are more extreme. The average daily return during drawdowns (-.13%) is 50% more extreme than the average daily return in an up-cycle (0.08%). “Stairs up, elevator down” is a familiar phrase. Avoiding the peak-to-trough drawdowns would have resulted in an average annual return of 15.94%, which is 2.12 times greater than the buy and hold average of 7.53%. Further, capturing the drawdowns by being short the market, could have increased returns by an additional 8.41% per year to 24.34%, 3.23 times greater than the buy-and-hold average. The volatility during drawdowns is not surprisingly higher at 1.26% versus 0.84%. Being short and being wrong, is not as bad as being long and being wrong – see matrix below. The goal of market timing is simple, even obvious: capture as much of the upside as possible and avoid as much of the downside as possible. If hedging on the downside, avoid more downside than you give up on the upside. It should also compensate for additional trading fees and taxes – if you are going to engage in market timing strategies, it’s best to utilize a tax deferred account. Measuring effectiveness Using up-capture and down-capture ratios enable us to evaluate other strategies against the buy-and-hold benchmark. From Investopedia: “The up/down-market capture ratio is used to evaluate how well or poorly an investment manager performed relative to an index during periods when that index has risen/dropped.” The traditional methodology for calculating up-capture and down-capture is to analyze it by month, year or rolling 3-year periods; we prefer to segment by peak-to-trough and trough-to-peak since it better captures all of the directional movement. We can also introduce another measure called the Total Capture Ratio, being the net returns relative to the sum of the maximum long and short returns achievable if we had perfect foresight. For example in our table above, our maximum possible capture would have been 1557.87% (1020.25% trough-to-peak, and 538.09% peak-to-trough). The actual buy-and-hold total was 482.16%, which represents 30.94% of the maximum possible capture. We can use this measure to compare to other strategies. Note: It is important to differentiate between market timing skills and stock picking skills, since they are distinctly separate. It is possible to have an up-capture ratio greater than 100% by picking stocks that outperform the index, but if we are only investing in the index per se, then the maximum possible up-capture ratio is 100%. In this article, we are dealing only with market timing and not stock picking, so 100% is the up-capture limit. Examining a 200-day moving average market timing strategy This strategy is common in the finance literature and goes long the S&P 500 when it is above its 200-day moving average, and to 100% cash when the S&P 500 is below its 200-day moving average. We use a two-day lag from signal to implementation. The results below show that overall the strategy is almost the same as the buy-and-hold strategy; 488.54% versus 482.16% for the sum of the daily returns. The strategy avoids a lot of the drawdowns (-169.60 versus -538.09% on the buy-and-hold) but also misses a lot of the up-capture (658.13% versus 1020.25% for the buy-and-hold). Factoring in transaction costs and taxes, it would likely be worse than the buy and hold. The volatility for this strategy is lower than the buy-and-hold (0.65% versus 0.97%) mostly due to avoiding the peak-to-trough drawdown periods, which are more volatile. The second part of the table showing the detail for each of the sixteen drawdown periods highlight this fact. Perhaps you are thinking it might be better with a different moving average period. Here are the results for a 100, 150 and 300-day moving average as well. The 200-day average still comes out on top, even though there really is no rationale to explain it. What if we go short, instead of going to cash, when the S&P 500 is below its 200-day average? The returns are very slightly better, but with higher volatility, so after adjusting for risk they are worse. Notice how we are positive in the drawdowns, but we now only capture 296.02% of the up-cycle returns. Comparing strategies in this format, it is easy to evaluate where the returns are coming from, how much are we giving up on the upside and how much are we avoiding on the downside, and what is the overall volatility? This was an example using a 200-day moving average strategy, but there are many varied strategies as described next. Types of Market Timing Strategies For a good overview of the different ways to time the market, see this article by famed professor Aswath Damodoran from NYU. He summarizes the different market timing approaches into the following five categories: Non-financial indicators, which can range the spectrum from the absurd to the reasonable. Technical indicators, such as price charts and trading volume. Mean reversion indicators, where stocks and bonds are viewed as mispriced if they trade outside what is viewed as a normal range. Macro-economic variables, such as the level of interest rates or the state of the economy. Fundamentals such as earnings, cash flows and growth. With few exceptions, only the last two can be considered for any type of market timing strategy that is based on cause and effect relationships. Since the first three have no cause and effect explanation they cannot be expected to perform over the long term; you may find periods when they seem to work, but you are hoping to get lucky. Here are our minimum criteria that a market timing strategy should meet, before being implemented: It must be based primarily on macroeconomic and fundamentals, with reasonable explanations for why there is cause and effect. It must be tested over many economic cycles and interest rate regimes, not just the most recent ten years. It must be 100% rules based, no emotional or discretionary overrides. Since it is based on historical returns or a back test, the incremental expected outperformance should cover the trading commissions, the potential taxes, as well as a strategy risk buffer. Our proprietary research has uncovered some meaningful results in back tests spanning forty five years, based on understanding the nature of the business cycle and how variables such as valuations, risk, interest rates and growth expectations, impact returns at different stages of the business cycle. The results implemented on the SPY ETF since 2001, including dividends , are shown here . As expected, the model has underperformed the buy-and-hold during the bull market of the past five years by about 2.5% per year, but since 2001, which includes two recessions, it has outperformed by significantly more. This is the nature of market timing strategies; expect to forgo some of the upside in bull markets but make it up, plus more, during downturns. The value of a market timing strategy is thus also a function of the frequency of significant drawdown periods. For example, as reported on CNBC , Brian Belski, chief investment strategist at BMO Capital Markets thinks we are 6 years into a 20-year secular bull market. If he is correct, then market timing strategies will likely underperform for the next 14 years. If historical averages are any indication, and a drawdown occurs on average every four years, then we are likely to see four more drawdowns in the next fourteen years, given that we have not had one since 2011. Or, consider that while interest rates may remain low for an extended period of time (by the end of the next 14 years it seems more likely they will be higher than today, given that they cannot go much lower) and that a rising rate environment may be conducive to greater than the average number of drawdown periods. Insurance You can think about it another way; think of the 2% you will likely give up every year in a bull market, as an insurance premium to protect the value of your portfolio. At current implied volatility levels, it would cost you about 7% per year to purchase at-the-money put protection on the S&P 500, so while a slightly different concept, a 2% premium seems reasonable, especially if it helps you avoid a 30% drawdown. Final thoughts If you don’t have the inclination or time to study how the market behaves, or have an advisor who does, then it’s best to stick with a simple diversified index strategy, but this is essentially a risk optimization strategy, so you should expect middle of the road results, with periodic drawdowns averaging around 30%. This may meet your needs, provided you don’t need to withdraw money during a drawdown, because that is difficult to recover from. It’s best to decide in advance whether you are going to try and exploit market timing. If so, then have a scripted, back tested plan and set it in place, but do not attempt to time the market on the fly, without a plan. Disclosure: The author has no positions in any stocks mentioned, and no plans to initiate any positions within the next 72 hours. (More…) The author wrote this article themselves, and it expresses their own opinions. The author is not receiving compensation for it (other than from Seeking Alpha). The author has no business relationship with any company whose stock is mentioned in this article.