Tag Archives: management

MLPJ: Yielding 9% With 18% Upstream Exposure
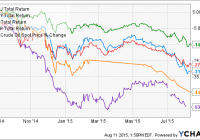
Summary Recent declines in the energy sector has punished small-cap energy stocks especially hard. MLPJ offers exposure to smaller-cap MLPs, as well as to other energy-related MLPs other than midstream MLPs. How has the MLP profile of MLPJ changed in the past six months? Introduction In a recent article , I provided an update on the Morgan Stanley Cushing MLP High Income Index ETN (NYSEARCA: MLPY ). This high-yielding, diverse MLP ETN was found to have reduced its exposure to upstream MLPs, which can be considered to be the most commodity price-sensitive segment of the MLP space. This change may potentially buffer MLPY against further declines in the price of crude oil. In the comment stream of that article, another user asked if the same phenomenon has occurred for the Global X Junior MLP ETF (NYSEARCA: MLPJ ). Therefore, this article seeks to address this question by analyzing the current holdings of MLPJ to determine whether its MLP profile has changed in the past six months. Moreover, this article describes the inclusion and weighting methodology for MLPJ, something that I did not cover in my previous article on MLPJ. MLPJ methodology MLPJ tracks the performance of the Solactive Junior MLP Compositive Index, which “is intended to give investors a means of tracking the overall performance of the small-capitalization segment of the United States master limited partnerships [MLP] asset class.” The inception of the ETF was January 14, 2013. Information for the methodology for MLPJ can be found on the Solactive website . The composition of the index is adjusted twice a year on the last business day of March and September. Therefore, the index has been adjusted only once since my last article on MLPJ. To be included in the index, an MLP must be focused on the “transportation, storage, processing, holding, refining, marketing, exploration, production, and mining with focus of natural resources”, and have a market cap of between $250M and $2.5B. It also must have an average daily trading volume of at least $500K in the last three months and a average monthly trading volume of at least 75K in each of the last six months. The 30-largest MLPs from this pool are then selected. The 30 MLPs chosen are then weighted according to market capitalization. The five-largest of these 30 have a maximum weighting capped at 9%, while the remainder are capped at 4.75%. The excess weight is allocated proportionally to all Index Components whose Percentage Weight is not capped. In summary, MLPJ is essentially a market-cap weighted index of the 30 largest energy-related MLPs under $2.5B. Recent performance The recent performance of MLPJ has not been pretty. Small-cap energy stocks were hit especially hard as investors fretted over the financial future of such firms. The following chart shows the 1-year total return performance of MLPJ and MLPY, as well as the benchmarks for the U.S. energy sector (NYSEARCA: XLE ) and the midstream MLP space (NYSEARCA: AMLP ). MLPJ Total Return Price data by YCharts The graph above shows that MLPJ’s performance (-31.4%) has been comparable to XLE (-27.3%) over the past twelve months. However, it has underperformed the midstream MLP ETF AMLP (-14.9%), while outperforming MLPY* (-44.5%). (*Note that the total return performance of MLPY, an ETN, may not be comparable to those of the other funds, which are ETFs, due to differences in tax treatment). Composition The constituents of MLPJ are given in the table below. Also shown is the % assets, ttm yield, market cap and type of each constituent . Note that as an ETN, the holdings of MLPJ are not publicly available on a daily basis. The % assets are obtained from the company while the ttm yield and market cap are obtained from Morningstar . In categorizing the type of company, I have used the classification types in the CBRE Clarion Securities MLP Master List website, which considers these following MLP or MLP-related classes: [i] traditionally structured midstream MLPs, [ii] upstream MLPs, [iii] traditionally structured other MLPs (“other”), [iv] variable distribution MLPs (“variable”), [v] MLP GP holding companies (“GP”), [vi] other publicly-traded companies that own GP interest in an MLP (“diverse”), and [vii] other MLP-related securities. Name Ticker Assets / % Yield / % Cap / B Type NORTHERN TIER ENERGY LP (NYSE: NTI ) 8.76 11.59 2.50 Variable CHENIERE ENERGY PARTNERS (NYSEMKT: CQP ) 7.36 5.41 10.50 Other ANTERO MIDSTREAM PARTNERS (NYSE: AM ) 5.92 2.06 3.40 Midstream FERRELLGAS PARTNERS-LP (NYSE: FGP ) 5.80 9.66 1.90 Other HOLLY ENERGY PARTNERS LP (NYSE: HEP ) 5.72 7.38 1.70 Other ALLIANCE RESOURCE PARTNER (NASDAQ: ARLP ) 5.70 10.93 1.80 Other NUSTAR GP HOLDINGS LLC (NYSE: NSH ) 5.65 6.78 1.40 GP EXTERRAN PARTNERS LP (NASDAQ: EXLP ) 4.29 11.02 1.20 Other MARTIN MIDSTREAM PARTNERS (NASDAQ: MMLP ) 4.25 11.48 1.00 Midstream SUMMIT MIDSTREAM PARTNERS (NYSE: SMLP ) 4.15 9.15 1.40 Midstream VALERO ENERGY PARTNERS LP (NYSE: VLP ) 4.05 2.30 2.80 Midstream VANGUARD NATURAL RESOURCE (NASDAQ: VNR ) 3.85 21.22 0.78 Upstream BREITBURN ENERGY PARTNERS (NASDAQ: BBEP ) 3.71 36.35 0.65 Upstream GLOBAL PARTNERS LP (NYSE: GLP ) 3.64 8.52 1.10 Other MEMORIAL PRODUCTION PARTN (NASDAQ: MEMP ) 3.57 29.18 0.61 Upstream ROSE ROCK MIDSTREAM LP (NYSE: RRMS ) 3.46 6.64 1.30 Midstream LEGACY RESERVES LP (NASDAQ: LGCY ) 2.71 24.84 0.55 Upstream TRANSMONTAIGNE PARTNERS LP (NYSE: TLP ) 2.40 8.21 0.53 Midstream EV ENERGY PARTNERS LP (NASDAQ: EVEP ) 2.40 24.77 0.46 Upstream CRESTWOOD EQUITY PARTNERS (NYSE: CEQP ) 2.37 15.49 0.66 GP DORCHESTER MINERALS LP (NASDAQ: DMLP ) 2.22 9.44 0.46 Variable WESTERN REFINING LOGISTIC (NYSE: WNRL ) 2.14 2.56 1.10 Midstream ALON USA PARTNERS LP (NYSE: ALDW ) 1.69 9.92 1.60 Variable ATLAS RESOURCE PARTNERS LP (NYSE: ARP ) 1.40 49.18 0.33 Upstream NATURAL RESOURCE PARTNERS (NYSE: NRP ) 1.24 32.47 0.34 Other FORESIGHT ENERGY LP (NYSE: FELP ) 0.81 13.88 1.00 Other VIPER ENERGY PARTNERS LP (NASDAQ: VNOM ) 0.74 4.93 1.10 Variable We can see from the table above that in addition to midstream MLPs (26%), MLPJ also contains a significant proportion of “other” (35%) MLPs. According to CBRE, “other” MLPs include all MLPs that are not midstream MLPs, but are structured like midstream MLPs (with a minimum quarterly distribution). These include coal, compression, shipping, oilfield services, wholesale distribution, and everything else. (Note: other authorities classify wholesale distribution as midstream). Examples of “other” MLPs in MLPJ include Ferrellgas Partners, a supplier of propane, and Alliance Resource Partners, a diversified coal producer and marketer. The allocations of MLPY are depicted in the chart below. How does this composition compare to six months ago ? The following chart shows the former, current and changes in the six categories of MLPs in MLPJ from six months ago to now. We can see from the chart above that the proportion of midstream holdings in MLPJ has decreased from 37% to 26%. Unlike MLPY , however, MLPJ has not seen a massive decline in upstream assets. The percentage of holdings in upstream MLPs decreased only slightly, from 19% six months ago to 18% today. The reason for this is that MLPJ, unlike MLPY, does not eliminate dividend cutters from its index. This is probably the reason why the upstream MLPs such as BBEP, which slashed its dividend in January of this year, survived the March rebalancing. Meanwhile, the upstream MLP ARP may yet see itself removed from the index if its market cap falls below $250M (its current market cap is $332M). Other notable changes the composition include an increase in the number of “other” MLPs, from 21% to 35%. An example of an “other” MLP to be added is the coal-based ARLP, which was added to the index as its market cap fell below $2.5B earlier this year. ARLP Market Cap data by YCharts Distribution Since my last article, MLPJ has paid out 3 more distributions. Unlike MLPY, however, which is an ETN and hence passes through the income received from its assets directly to unitholders, MLPJ is an ETF, which allows it to control its distributions. The last two quarterly distributions were increased by 1 cent each, representing increases of 4%. However, as some of this income may be return-of-capital, it is difficult to anticipate the sustainibility of the dividend going forward without a comprehensive analysis of the dividend future of each individual company. Risks MLPJ contains companies that are smaller in size compared to those found in the large-cap funds AMLP or AMJ. Moreover, energy-related MLPs are, to various extents, acutely sensitive to commodity prices, and the 8.80% distribution may or may not be sustainable. Additionally, there is a significant risk of capital loss if energy prices slide further. Finally, MLPJ’s expense ratio is 0.75%, which slightly lower than that for AMLP or JPMorgan Alerian MLP Index ETN (NYSEARCA: AMJ ) (0.85%). Conclusion This article was intended to provide an update on the MLP profile of MLPJ, a small-cap MLP fund, as requested by a reader. MLPJ’s midstream exposure was decreased by 10% (absolute percentage) while its “other” MLP exposure was increased by 14% (absolute percentage). Furthermore, and unlike MLPY (which has rules to eliminate dividend cutters from its index), MLPJ has not dramatically reduced its exposure to upstream MLP companies, which still remains at a robust 18%. The upstream MLP companies still remaining in MLPJ include VNR (3.85% of assets), BBEP (3.71%), MEMP (3.57%), LGCY (2.71%), EVEP (2.40%) and ARP (1.40%). Consequently, investors uncomfortable with owning upstream MLPs in any capacity should obviously avoid MLPJ due to its 18% exposure to upstream companies. On the other hand, more risk-seeking investors anticipating a rebound in oil prices actually favor MLPJ due to its 18% upstream MLP exposure. As upstream MLPs have fallen among the hardest as crude oil prices slid, it is not unreasonable to expect their share prices to snap back the quickest if oil prices do rebound. As there is no MLP fund dedicated exclusively to upstream MLPs, MLPJ may be a decent choice for investors who want exposure to upstream MLPs but are uncomfortable with picking individual companies. Disclosure: I/we have no positions in any stocks mentioned, and no plans to initiate any positions within the next 72 hours. (More…) I wrote this article myself, and it expresses my own opinions. I am not receiving compensation for it (other than from Seeking Alpha). I have no business relationship with any company whose stock is mentioned in this article.

The Good And Bad News About Those ‘Driverless Investment Vehicles’

New technologies always excite the animal spirits. Take commercial drones, for instance. At first blush, these pilotless aircraft offer nothing but excitement and good news. Ah, but, there’s “the other side.” And the same is true of “robo-investing” … robo-anything! Amazon (NASDAQ: AMZN ) would be shipping goods to our doorstep via drones, people could watch sporting events up close and personal without having to buy a ticket, you could borrow a cup of sugar from your mom who lives a few miles away, and there would be fewer trucks and vans on our roadways. Sounds pretty good, doesn’t it? Well, put away your Jetsons fantasy for a moment, anyway. It could all happen but, along the way, we need to face the reality that any idiot can buy a drone and do any damn-fool thing they want. That includes voyeurs who want to peep into your private lives. Do you need to keep the curtains closed instead of enjoying a beautiful day or night? It includes pyro-voyeurs flying their drones into wildfire suppression areas, preventing retardant and water carrying aircraft from flying, and increasing the risk of death to firefighters. It includes flying their new toys higher than legally allowed, increasing the risk of mid-air collision with piloted aircraft. You think a bird strike is bad? Add the velocity and weight of even a small drone and imagine the results. Or consider a lone wolf terrorist who doesn’t care what the ultimate regulations might be for controlling drone traffic. What if he launches a few directly into the engine of an A-380 while its engines are running as it awaits its turn to take off on a crowded runway? Then there are the driverless cars being touted as the way to relieve urban traffic congestion; let you read, watch TV or play video games on your daily commute; reduce accidents; and clean up the environment. Let’s talk about vehicle safety. Have you seen the video where a Jeep driven by a human journalist has the systems overridden by faraway hackers and driven into a ditch? (Gently driven into a ditch; this was, after all, a controlled experiment.) Now imagine if a terror group or sovereign state like, say, Iran, Russia or China, with vast cyber-hacking armies under their command, decided to reverse the accident-avoidance systems of cars in the 25 largest American cities just before rush hour, sending vehicles with no allowance for human override careening into each other at high speeds. I love new technologies. But it bears pointing out that there are many sides to every innovation – and that human intervention should be part of any fail-safe robotic system. Otherwise we all become subjects of the old joke about the new pilotless commercial aircraft, where the announcement comes on after takeoff, “Ladies and gentlemen, welcome to USAmDeltaUnited flight # 65492 from Detroit to Puerto Rico. Embracing new technology, we are proud to announce there are no pilots aboard the aircraft and a cabin crew is not necessary since anything you need, our automated robotic attendants can provide. So relax, sit back and enjoy the flight. And remember, nothing can go wrong, hic!, nothing can go wrong, hic!, nothing can go wrong…” Remotely Piloted Aircraft – Test Flight with Passengers (and, for now, a human pilot on board to do the take-off and landing…) (click to enlarge) Like these two new technologies, a certain style of investment management and portfolio allocation has risen its head yet again – as it always does after a 5 or 6 year bull market. The benefit of these approaches is that they don’t require any decision-making. These are automated investment plans that take one of two typical variations: (1) The Bogle School, whose mantra is “Wall Street is a Random Walk so don’t try to beat the market. Just buy and hold a diversified ETF or mutual fund that mirrors a broad-based benchmark like the S&P 500. Never sell until you need to take some funds out for retirement, college or some other important life event.” (2) “Use a robot!” This will be either some quant black box approach that determines when to buy and sell or, better, rebalances a diversified portfolio tied to many different benchmarks like emerging markets, small cap US, large cap international, etc. The rebalancing forces you to buy low and sell high. When one part of the portfolio performs better than the others and another performs worse, the percent of each held will deviate from your chosen parameters, and you’ll rebalance. This approach assumes a steady reversion to the mean so you are, theoretically, selling a part of your winners and adding to your losers, which will revert to the mean and become winners. Our firm starts with something like #2 here but we then add enhancing strategies to tell us what and when to sell and what and when to buy. But for now let’s forget about adding the human element we use, and just take a look at these two very-popular-today “driverless investment vehicles.” Buy-and-hold is great. Until it isn’t. There are two problems with buy-and-hold. As sure as the sun will rise tomorrow, the market will at some point enter a bear market. If there were no bear markets, there’d be no risk and hence no reward. One of two things will happen to buy-and-hold investors during a bear market: either they will hold on or they won’t. Neither are attractive alternatives. In 2008, the S&P 500 lost 38.5% of its value. $100,000 became $61,500. If Mr. Buy-and-Hold held on, he was rewarded when, in 2009, the market rebounded 23.5%. (From March 9 forward, that is; he was down even further in Jan/Feb 2009.) Not too bad, right? Ummm… Not so fast. A 23.5% rise on $63,500 is not the same as a 23.5% rise on $100,000. That rebound in 2009 only took his portfolio back to $75,953. In 2010 a 12.8% rise in the S&P, however, got him back to $85,675! Regrettably, 2011 was exactly flat on the S&P so he spent another year underwater at $85,675. 2012 was a good year and his portfolio increased to $97,156. Then, finally, in early 2013, he broke even. So if Mr. Buy-and-Hold held on for 4 years (dividends would have reduced this holding period somewhat) he’d have suffered confidence, despair, hope, relief and, today, with the unusually strong bull of the last two years, perhaps a misplaced hubris. The alternative would have likely been worse. If Mr. Buy-and-Hold threw in the towel somewhere along the way, maybe in January 2009, he’d have lost 40% and would have gotten back in…when? After the market was up 10%? 20%? 30% ? At some point of emotional despair, Mr. Buy-and-Hold became Mr. Buy-and-Panic and might still not have recouped his losses. That brings us to the latest fad, “Do it Yourself on our Website!” These are the new “robo-investing” sites that tell you that you shouldn’t pay someone else when you could be paying the robo-site much less. I believe a robo-investing site that rebalances regularly but without any human understanding or input about market history, technical analysis, fundamental analysis as to the external economic environment, or behavioral analysis of investor and consumer sentiment is a dangerous place to be – a la the automated airplane. (“Nothing can go wrong, hic!, nothing can go wrong, hic!, nothing can go wrong…”) The problem with robo-investing is that one “might” never experience as serious a loss as Mr. Buy-and-Hold, but Ms. Rebalance-with-Regularity will also never hold on long enough to enjoy long-term sector outperformance. By selling on the basis of an arbitrarily-selected date and a graven-in-stone universe of geographic (US, international, emerging market, etc.) and/or capitalization-weighted (US large cap, foreign mid-cap, etc.) one decides, in advance, to leave much on the table in exchange for not losing big. How much is too much? Besides, if it isn’t possible to beat the benchmarks, then what accounts for the steady outperformance over many years of some of my colleagues with whom I exchange ideas every month? By coincidence the latest issue of Gray Cardiff’s Sound Investing just hit my inbox as I’m writing this. In it, Gray notes that The Hulbert Financial Digest verifies that Sound Advice has earned 11.3% annually since 3/31/2000 versus 2.2% for the S&P 500. And I should note, immodestly, that our own G&V Portfolio has returned 9.4% annually versus the S&P’s 5% over a slightly longer period from 1/1/1999. (My numbers include all S&P dividends.) Maybe Gray and I and all the other colleagues I credit in these pages from time to time have just been lucky for a decade or more. Or maybe it pays to have a human driver; it doesn’t have to be a registered investment advisor – it could be you, me, or someone else you trust, as long as they focus steadily on the road ahead and keep their hands firmly on the wheel. Here’s what I personally see as I look down that road… I expected great things from 2015 at the beginning of the year. It looked as if the economy was going to be able to stand on its own without Fed intervention; it was the third year of the presidential election cycle, a time when the party in power typically juices the economy and the markets; and it seemed as if China, India and Europe were all getting their act together. That’s what it still looks like – in the rear view mirror. Looking ahead, however, I see… The Hotel California in China “Relax” said the night man, “We are programmed to receive.” “You can check-out any time you like, but you can never leave!” These last words from the Eagles 1977 hit song ‘Hotel California’ pretty much sum up the state of things in China right now. You can buy all the stock you like; heck, they’ll even encourage you to buy it on margin. But sell it? How dare you? That would bring the whole Ponzi scheme down in days! (‘Hotel California’ is actually a doubly appropriate reference here; according to the Eagles, the song is about the phoniness and materialism they encountered in L.A. as they began to go from sort-of-known to hitting the big time. If the shoe fits…) At this point, the Chinese authorities have demanded internal records from Chinese and foreign brokerage firms who must prove they never helped fund or facilitate any short-selling; accused a US hedge fund of plotting to bring down prices; instructed the large Chinese state-owned companies with cash in the till to buy additional shares of Chinese companies; stopped all IPOs that may take funds away from current stock purchases; directed more state companies to invest in stocks rather than real estate; and (de facto) instructed Chinese pension funds and mutual funds to invest less in bonds and more in Chinese stocks. That’s a pretty Draconian reaction to a stock market correction that still leaves the Shanghai and Shenzhen exchanges solidly in the black for the year. Which leads me to wonder – what does the Chinese leadership know that we don’t know? My best guess is that they know that the productivity, GDP, real estate values, labor and other numbers being sent out for public consumption are less than wonderful. Basically, they don’t want anyone to look behind the curtain and see what Oz really looks like. We not only won’t be buying this correction, we are now shorting China. As Cnut (‘Canute’), king of Denmark, England and Norway, is alleged to have said to his courtiers and toadies back in the 1020s or so, when they told him he was so powerful he could stop the incoming tide, “No… I can’t.” (Okay, what Henry of Huntingdon reports Cnut really said was “Let all men know how empty and worthless is the power of kings, for there is none worthy of the name, but He whom heaven, earth and sea obey by eternal laws.” In other words, “No… I can’t.”) It seems the autocrats and oligarchs that constitute China’s elite Party members have yet to learn Cnut’s humility. It may take a while to work out, but when it comes to choice between the dictates of rulers and market forces, I’ll take market forces every time. The Presidential Election Cycle Typically, the year before a US Presidential election is a darn good one. And this may yet to prove to be, after we get through the dog days of summer. But for now things are not looking good. Indeed, unless we can mount a rally in the next six to eight weeks, it may be a long cold winter that follows this long hot summer before we can get back to moving forward. That’s because the markets hate uncertainty and the uncertainty markets hate most is which political scourge or savior will replace the current president and, by reflection, who he or she will select as their senior advisors and which representatives may be swept in on their coattails. The chart following is not graven in stone. The chart below is only the average of all years since 1896, and it is only on the Dow Industrials which may be disconnected from other benchmarks. Still, in the event this election cycle is somewhere near the average, it means we are in for a yawner for the next eight months or so, followed by a 2016 summer of discontent before we get the election uncertainty behind us and the market moves ahead smartly for a few months in the reflected glow of “Hope and Change” or whatever the next occupant at 1600 Pennsylvania has promised. Please note that the quarter that ended June 30 (bar 3 on “Year 3” above) was pretty much flat, not nearly as good as the “average.” One might interpret this as meaning there is pent-up demand, or that the handwriting is already on the wall for a queasy next few months, or that, pshaw, it’s just a bunch of numerology that don’t mean nuthin’. I lean toward door #2. As a rapt student of market history, I’ve lived through a lot of these, and that uncertainty thingy tends to get us every time. Not that there’s anything uncertain about 17 Republican presidential candidates and at least 3, maybe more, Democratic candidates, with a strong likelihood that, if not selected, Mr. Trump’s natural narcissism will cause him to run as an independent, continuing his clever way of telling us what we want to hear whether he believes it or not. Yes, 2016 could be complicated this time around. The Fed, Greece, ISIS, Ukraine, Iran, Russia, Etc. You don’t really need me to re-hash all these, do you? Any one of them could (continue to) create even more uncertainty. And, of course, there’s always some economic or political event over the horizon that we can’t see yet. So let’s just move on to… What Are We Doing About It? We’re reallocating our portfolio strategy to reflect what we believe to be the likelihood of a dull market that vacillates between heightened expectations and dashed expectations. That means lightening up on developing markets, energy, industrials, materials, utilities and even some technology firms. It means keeping our health care exposure and adding a bit to the consumer discretionary sector, one of the few bright spots we see as American consumers, tired of belt-tightening, loosen up a little and spend on something fun. It means looking for financials that will benefit as rates rise, which they inevitably will. We’ll leave it to others to benefit via shorting Treasuries and so on; we’ll instead buy insurers and regional banks that are already selling for single digit PEs. We’ll buy some defensive issues in the food and beverage area. And we will hedge our longs with a couple of good inverse ETFs. To wit… We will keep our Wisdom Tree Europe Hedged Equity (NYSEARCA: HEDJ ) because I see continued strength in the US $, making Euro exports relatively cheaper, but we will protect our gains with trailing stops. We’ll sell all shares of Guggenheim S&P 500 Pure Growth (NYSEARCA: RPG ) however. We’ll keep our shares of Royal Dutch Shell (NYSE: RDS.B ) and add to them if prices continue to decline, and we’ll trailing-stop some shares of Wisdom Tree Germany (NASDAQ: DXGE ). We’ll hold onto Marathon Petroleum (NYSE: MPC ) and BP (NYSE: BP ) — for now. At our cost basis and yield-to-cost, we’ll hold Royal Bank of Scotland (NYSE: RBS ) until they force redemption upon us, which they will some day. We feel strongly about the fine portfolio of Tekla Health (NYSE: THQ ), even though it has done nothing so far, so it’s a keeper. We’ll add a bit to our Franco Nevada (NYSE: FNV ). Even if the price of gold and silver don’t recover, FNV is so well-managed that I’m certain there are price-decline and bankruptcy provisions in the loans they make to smaller gold producers that will allow them to emerge from any gold price decline or range-bound trading with a greater share of the gold that is actually produced. Gold won’t stay down forever and it often does best in times of uncertainty. As an income play, I like the preferreds of Public Storage (NYSE: PSA ), particularly the A, T and V preferreds. A better jobs picture means lots more mobility and relocation. Relocation means more people put stuff in storage – as do empty-nesters downsizing and businesses that need a place to store inventory without taking on long-term leases for more space. PSA is the class act in this industry so I see their preferreds, all yielding around 5%, as a great way to invest for income without seeing anything more than a miniscule decline if US interest rates rise. Since we have no real hedge against a serious market decline in this portfolio, I’m also adding some shares of ProShares UltraShort S&P 500 (NYSEARCA: SDS ), which moves inverse to the S&P 500 at double the rate of movement, as well as shares of the iPath S&P 500 VIX (NYSEARCA: VXX ), which is a reflection of the volatility I imagine we’ll be seeing more of in the coming weeks and months. Also we’ll buy, not as a hedge for our long positions but as an outright short on hubris and autocracy, shares of Direxion CSI 300 China A Shares (NYSEARCA: CHAD ). CHAD is an unleveraged short on the 300 largest and most liquid Chinese A Share companies. The Chinese government will do their best to thwart this investment but I say free markets will triumph and we could see rather large profits from this ETF. Finally, we will buy one additional ETF: Fidelity MSCI Consumer Discretionary (NYSEARCA: FDIS ). While it is capitalization-weighted, it covers the entire MSCI (Morgan Stanley Capital International) index so it also includes some non-US firms that I believe will benefit from selling consumer discretionary goods and services to US consumers. As Registered Investment Advisors, we believe it is essential to advise that we do not know your personal financial situation, so the information contained in this communiqué represents the opinions of the staff of Stanford Wealth Management, and should not be construed as “personalized” investment advice. Past performance is no guarantee of future results, rather an obvious statement but clearly too often unheeded judging by the number of investors who buy the current #1 mutual fund one year only to watch it plummet the following year. We encourage you to do your own due diligence on issues we discuss to see if they might be of value in your own investing. We take our responsibility to offer intelligent commentary seriously, but it should not be assumed that investing in any securities we are investing in will always be profitable. We do our best to get it right, and we “eat our own cooking,” but we could be wrong, hence our full disclosure as to whether we own or are buying the investments we write about. Disclosure: I am/we are long FDIS, PSA-T, THQ, BP, FNV, RBS, VXX, CHAD, HEDJ, MPC, SDS. (More…) I wrote this article myself, and it expresses my own opinions. I am not receiving compensation for it. I have no business relationship with any company whose stock is mentioned in this article.

There’s Still Time To Lower Your Exposure To Riskier ETFs

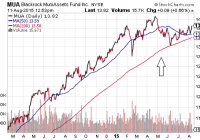
By itself, a “death cross” may not be particularly meaningful. However, when both the Dow Jones Industrials and the Dow Jones Transportation Average are flashing warning signs, stock valuations as well as risk preferences become increasingly important. As I have written previously, a tactical approach to asset allocation does not require that you abandon participation altogether. These tactical shifts will weather a hurricane, as well as permit me to raise risks at more attractive prices. A fair number of commenters, callers and perma-bulls were relatively tough on me in May when I suggested a strategic decision to raise cash levels . They were even tougher on me when I mentioned the possibility of picking up safer havens like intermediate treasuries via the i Shares 7-10 Year Treasury Bond ETF (NYSEARCA: IEF ) and intermediate-to-long duration municipal bonds via the BlackRock MuniAssets Fund (NYSE: MUA ). There’s no doubt about it… I was early on the call. Yet the idea behind raising cash as well as bolstering one’s allocation to investment grade securities (e.g., treasuries, munis, etc.) emanated from a well-reasoned interpretation of the data. At the corporate level, earnings growth had been waning, revenue had been contracting and non-financial companies had more leverage (37%) than they had back in 2007 (34%). At the macro-economic tier, wage increases had been flatlining, manufacturing had been crumbling and transporters in the iShares Transportation Average ETF (NYSEARCA: IYT ) had been dying a death by a thousand small cuts. Keep in mind, many had been dismissing the struggles of shippers, truckers, railways and airlines as irrelevant. After all, the big industrials were not tanking in the same manner as the big transporters. Until now. Industrial corporations – both in the Dow Jones Industrials average as well as the Industrial Select Sector SPDR ETF (NYSEARCA: XLI ) – have succumbed to the same technical pattern of weakness. Specifically, the shorter-term 50-day moving average has crossed over and below the longer-term 200-day trendline (a.k.a. “the death cross”). By itself, a “death cross” may not be particularly meaningful. However, when both the Dow Jones Industrials and the Dow Jones Transportation Average are flashing warning signs, stock valuations as well as risk preferences become increasingly important. Back in May and in June, valuations across nearly every metric of respectability had already reached the 2nd priciest in history (2nd only to the year 2000). Consider Buffett’s favorite indicator, market cap to GDP. As of this moment, the Wilshire Total Market Index market cap is roughly $21850 billion. That’s 123% of GDP. By this metric, the US stock market is only expected to annualize at about 0.3% with returns from dividends over the next decade. (See Market Cap To GDP chart below.) As I warned back in early June , investors would, at that time, need to monitor the market internals to gain perspective on risk-averse behavior. Risk-off behavior had not yet materialized completely. Here on August 11, the NYSE A/D Line’s 50-day trendline has not yet crossed over and below its 200-day moving average. It appears poised to make that transition. Yet equally concerning is the reality that the A/D Line itself had fallen below its 200-day for the first time since July of 2011 . Meanwhile, there have been a series of lower lows for the A/D Line since I first began highlighting market internals in May. Risk preferences – risk-taking versus risk-aversion – can be witnessed across a variety of measures and a variety of asset types. Indubitably, risk-aversion has the momentum, whether one is looking at recent relative performance of large-cap over small-cap, domestic over foreign, or investment grade credit over higher-yielding credit. Over the last two months, IEF has gained 3.1% whereas the iShares iBoxx $ High Yield Corporate Bond ETF (NYSEARCA: HYG ) has lost 1.7%. The demand for safety is trumping the risk of “junk.” One final sign that serves as a huge “yellow” caution: the S&P 500’s Advancing-Declining Volume Line (AD Volume Line). In essence, if the AD Volume Line is rising, there is significant strength behind advancing stocks. If it is falling, however, you have significant selling pressure behind the decliners. Right now, the S&P 500’s AD Volume Line isn’t just falling. Its 50-day moving average has fallen below its 200-day moving average for the first time since… yes, you guessed it… July 2011. By way of review, extreme valuations for equities have existed for the better part of a year. (Note: This can viewed a dozen ways at my “Don’t Party Like It’s 1999″ commentary.) Macro-economic weakness has been getting weaker, whether it is the lack of consumer spending, the breakdown in business spending, manufacturing woes, wholesale inventory buildups, export deceleration, slumping commodities, wage flatness and/or labor force participation. Micro-economic concerns may be summed up with earnings stagnation and the “revenue recession.” (Note: I discussed the “macro” and “micro” at great length at the end of July in “5 Reasons To Lower Your Allocation To Riskier Assets.” ) And market internals? Nearly every conceivable way that I’ve looked at them – from lack of breadth in equities, to missteps by leaders like Apple (NASDAQ: AAPL ) and Disney (NYSE: DIS ) to widening credit spreads to treasury demand – “risk-off” is garnering the limelight. As I have written previously, a tactical approach to asset allocation does not require that you abandon participation altogether. I have moved the bulk of my client base (over the last three months) from a 65% equity stake (e.g., domestic, foreign, large, small, etc.) and 35% income position (e.g., short, long, investment grade, higher yielding, etc.) to something that might resemble 55% stock (mostly large-cap domestic), 25% income (mostly investment grade) and 20% cash/cash equivalents. Cash today will reduce the adverse impact of significant price depreciation. The same can be said for larger domestic companies faring better in the storm than foreign companies or smaller corporations; similarly, investment grade should provide relief where higher-yield debt is likely to struggle alongside other riskier assets. In other words, these tactical shifts will weather a hurricane, as well as permit me to raise risks at more attractive prices. Additional evidence of market internals “rolling over” completely might encourage the use of other “risk-off” measures. For instance, 55% stock might be lowered to 40%, bolstering the overall cash stash to 35% (or one-third). Another possibility? Multi-asset stock hedging. My colleague and I created the FTSE Multi-Asset Stock Hedge Index (MASH) for those who wish to neutralize stock crises and stock bears without using leverage, options or shorting. Components of the index include ETFs like the PIMCO 25+ Year Zero Coupon U.S. Treasury Index ETF (NYSEARCA: ZROZ ), the PowerShares DB USD Bull ETF (NYSEARCA: UUP ), the CurrencyShares Swiss Franc Trust ETF (NYSEARCA: FXF ) and the iShares National AMT-Free Muni Bond ETF (NYSEARCA: MUB ). Click here for Gary’s latest podcast. Disclosure: Gary Gordon, MS, CFP is the president of Pacific Park Financial, Inc., a Registered Investment Adviser with the SEC. Gary Gordon, Pacific Park Financial, Inc, and/or its clients may hold positions in the ETFs, mutual funds, and/or any investment asset mentioned above. The commentary does not constitute individualized investment advice. The opinions offered herein are not personalized recommendations to buy, sell or hold securities. At times, issuers of exchange-traded products compensate Pacific Park Financial, Inc. or its subsidiaries for advertising at the ETF Expert web site. ETF Expert content is created independently of any advertising relationships.