Tag Archives: management

On Reflection – What Would Happen If A Market Gave Investors More Time To Pause For Thought?
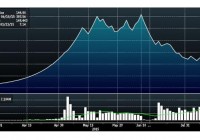
By Kevin Murphy The extreme price volatility experienced of late by the Chinese market has led to the introduction of a variety of measures, including the suspension of trading in numerous companies that we highlighted in Crash course and Key take-away . Almost everything we have read on the subject has painted this kind of market manipulation as an unequivocally bad thing but might there not be a contrarian view? Of course there might and, as instinctive contrarians, here on The Value Perspective, we are happy to offer it. So, would a market where investors are not being quoted stock prices every millisecond really be such a bad thing? To test that idea, let’s imagine a parallel universe where stock quotes happen, say, once a week and see if there are any investment lessons we might take from that. Much of the extraordinary rise seen in China’s markets was driven by what is known in some quarters as ‘momentum’ and in others, less politely, as ‘greater fool theory’ – the idea that, no matter how high a price you pay for a stock, there will always be someone out there with one or two fewer IQ points, who will be prepared to take it off your hands. This does not, of course, always prove to be so. For a very recent example, take a look at the following chart, which shows the trading volumes and price journey of shares in the audio and video entertainment business Baofeng Beijing Technology – the Chinese YouTube, so to speak – after it floated in March. You can see that trading volumes only really picked up after the share price had risen exponentially. (click to enlarge) Source: Bloomberg August 2015 What that suggests – aside from that plenty of people will be out of the money after Baofeng’s recent falls – is that investors can often focus on a stock more because of its price journey than anything that underpins it fundamentally. As such, those investors who thought it a good idea to buy Baofeng at 380x its prospective earnings would have needed to find themselves a particularly sizable fool. So the first investment lesson we might take from our parallel universe and its markedly less frenetic stock market is that, once the constant opportunity to sell on shares is removed, investors have to think a little harder about business fundamentals. Their ability – or, perhaps more accurately, their belief that they will be able – to find a greater fool will have been significantly reduced. A second investment lesson relates to time horizons, which, as regular visitors to will know, we think about a lot on The Value Perspective. Warren Buffett once observed: “I never attempt to make money on the stock market. I buy on the assumption that they could close the market the next day and not reopen it for five years.” As it happens, five years is also the average length of time we own a share. Our focus on business valuation and the margin of safety that it offers means that, here on The Value Perspective, we would not to be too concerned about having to operate in a market that did not quote prices every second of every day – though we of course acknowledge our investors always feel happier knowing they can access their money when they wish. So does this all mean we yearn to operate in that parallel universe and its more considered stock market, where one might expect to see a much greater focus from investors on business fundamentals and longer time horizons? Absolutely not. That would see a lot more people encroaching on our investment turf. As contrarians, we are – this time – perfectly happy with the status quo.
ONEOK Continues To Be Dragged Down By Its MLP

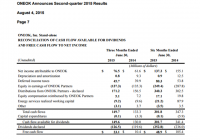
Summary ONEOK reports its Q2 2015 results. Numbers were inline with guidance. However, the stock still fell on the news. ONEOK will not recover until its MLP ONEOK Partners achieves sustainable levels of cash flows. As a holder of several large cap midstream MLPs and General Partners, the performance of ONEOK, Inc (NYSE: OKE ) has been extremely disappointing. When I bought the stock, it had just provided some very bullish Increase guidance for 2015 . Yet, due to the collapse seen in commodity prices late last year, the company slashed its dividend growth estimates considerably. Add to that the general market sell off, ONEOK has been a house of pain to hold. Last week, ONEOK reported its Q2 2015 results. All things considered, these were strong numbers. Net income was $76.5M, up 24% from $61.6M last year. On a per share level, net income was $0.36, up a similar 24% from $0.29 per share last year. Distributions declared from ONEOK Partners (NYSE: OKS ), which constitute the vast majority of ONEOK’s cash flows, were $171.2M, up 9% from $156.5M last year. As for Cash flow available for dividends, this key metric was $149.6M, up 15% from $130.0M last year. This left ~$23M in excess cash flow and resulted in a strong 1.18x dividend coverage ratio, versus ~$11M in excess cash flow and 1.09x coverage last year. (click to enlarge) Guidance remains unchanged As for ONEOK’s guidance, not much has changed. The company expects cash flow available for dividends to range from $570M to $650M (~$153M per quarter), and excess cash flows to range from $90M to $120M (~$26M per quarter). Given these are close to the numbers posted for the first half, this guidance does not seem very hard to achieve. Results from ONEOK Partners need to improve ASAP While ONEOK numbers were good, the same could not be said for the MLP ONEOK Partners. This is important given that the vast majority of ONEOK’s cash flows come from this unit. For the quarter, ONEOK Partners posted $387.3M in adjusted EBITDA, a key metric for profitability in MLPs, $276.9M in DCF, and a 0.88x coverage ratio. This compares to adjusted EBITDA of $360.9M, DCF of $272M, and a coverage ratio of 1.02x, last year. In other words, ONEOK Partners did not fully cover its distribution in Q2 2015, though it did see an improvement from the 0.60x coverage ratio for Q1 2015. This shortfall is largely a result of weak commodity price, mainly NGLs and natural gas. While the revenues for the MLP are mostly fee-based, the commodity margin based contracts have taken a beating, resulting in much weaker profits. ONEOK Partners is trying to grow its way out of its problem, hoping to expand volumes on its systems by bringing online flare gas and adding processing and gathering capacity to underserved fields. However, in order to grow, ONEOK Partners needs to spend money on its capital programs. This has forced the company to issue units via its ATM program, selling 5.5M units for $208.1M in the quarter. With the yield above 10%, this is some very expensive capital to raise. Nevertheless, ONEOK Partners is expecting its adjusted EBITDA to tick higher in the next few quarters, with the guidance range for the full year reaffirmed at $1.51B to $1.73B, or a midpoint of ~$405M per quarter, up 5% from the Q2 numbers. Assuming a similar DCF to adjusted EBITDA ratio, this increase should put the company closer to a 1.00x coverage ratio. Conclusion While the numbers from ONEOK were strong, ONEOK Partners is the reason the stock is not trading higher. As long as the MLP remains underwater with its distribution, the market will continue to price both with additional risk as shown by the near 7% yield for ONEOK and 10% yield for ONEOK Partners. One way ONEOK could solve its problems is via a consolidation similar to that of Kinder Morgan (NYSE: KMI ) or Williams Companies (NYSE: WMB ) (NYSE: WPZ ). However, I do not see a move like this coming anytime soon given the weak commodity price environment. Disclaimer: The opinions in this article are for informational purposes only and should not be construed as a recommendation to buy or sell the stocks mentioned. Please do your own due diligence before making any investment decision. Disclosure: I am/we are long OKE, OKS, WMB, KMI. (More…) I wrote this article myself, and it expresses my own opinions. I am not receiving compensation for it (other than from Seeking Alpha). I have no business relationship with any company whose stock is mentioned in this article.

Invest In Africa’s Growth Through The Market Vectors Africa Index ETF

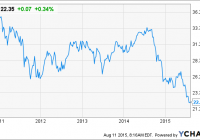
Summary The Market Vectors Africa ETF provides diverse exposure to Africa’s growth, and strategically invests over 40% of its assets in the banking industry. Earnings for 9 out of 10 of the fund’s top ten holdings increased, as the fund’s price sharply dropped in 2014. The Global X MSCI Nigeria ETF is extremely undervalued at the moment, and presents a unique buy opportunity for those willing to risk investing in a low oil price environment. The Market Vectors Africa Index ETF (NYSEARCA: AFK ) is the simplest and most efficient solution for investors to gain exposure to Africa’s economic growth. The fund has experienced a sharp drop in price since 2014, which is not at all correlated to the financial earnings of the fund’s major holdings. This has created substantially low valuation for the fund. Moreover, the economic outlook for Africa is favorable, with overall projected growth in the country’s that the fund invests into. Demographics in this region are also favorable, as the population is growing by more than 2% and 43% of the population is younger than 15. Moreover trends of urbanization are rising, although approximately 70% of the population earns their income from agriculture. That being said, Africa certainly has challenges ahead of it, and this fund is most appropriate for investors who are willing to take a long term horizon, and confidently hold if the fund experiences a further drop in price. Growth projections for this region have been lowered to 4.2%, with a slightly higher forecast for 2016 and 2017; this is due to concerns with the impact of low oil prices on Algeria and Nigeria, and difficulties in electricity supply in South Africa. While fully acknowledging these threats, I still remain bullish on Africa and believe that some options listed on U.S. Exchanges, although there are not many, provide ample opportunities for investors to gain exposure to Africa’s future growth. AFK data by YCharts 12 Month Economic Outlook Overall, the economic outlook for the five main countries that the fund invest into looks favorable. Average annual GDP growth was recently 3.65%, and is projected to increase to 4.1% in the next 12 months, an accurate projection of the projections for Sub Saharan Africa. Consumer Spending is projected to increase by around 3.3% for these countries, with the highest growth being in Morocco and Kenya. Areas of concern include the projected decrease in exports, and the issues previously mentioned with South Africa and Nigeria. Annual GDP Growth Annual GDP Growth Projection in 12 Months 12 Month Consumer Spending Growth Projection 12 Month Export Increase Projection Nigeria 3.96% 5.08% 2.3% -1.4% Egypt 3% 5% -0.4% -10.9% South Africa 2.1% 2.1% -2% 3.3% Morocco 4.3% 2.76% 7.3% -1.8% Kenya 4.9% 5.46% 9.4% -5.4% Top Fund Holdings By examining the fund’s top ten holdings , it is clear to see the sharp drop in fund price was not correlated to the fund’s financial performance, and has created an excellent buy opportunity. While the fund’s price dropped substantially in 2014, all companies, except for Nigeria Breweries PLC, were able to increase in net income. Banking industry The baking industry in Africa has a very favorable outlook and substantial growth ahead, which is another positive driver for this fund, which invests around 40% of its assets in this industry. Financial performance of the fund’s holdings was excellent, with the five companies having an average of 14.8% increase in net income during 2014. The widespread introduction of mobile banking throughout Africa has been a huge catalyst for the industry’s growth, and the high unbanked population in Africa provides room for further growth in this industry. The holdings in the banking industry in this fund have extremely attractive valuation, and represent a positive compliment to the high valuation of Nigeria’s consumer product industry. Unfortunately none of these companies are listed on U.S. exchanges, but can be considered a positive driver for the fund Nigeria Focus While the negative impact of Boko Haram and low oil prices should certainly be considered negative drivers for Nigeria, the country has key strengths in multiple industries that offsets this risk. The rise of the consumer products industry and banking industry in Nigeria, coupled with massive infrastructural developments, have resulted in an economy that is more diversified and less vulnerable to oil prices. While Its export earnings are highly dependent on the price oil, the country’s GDP is extremely diversified, with oil only attributing to 14% of the country’s GDP. The consumer products industry is on the rise, although valuation is a concern, and the banking industry also displays ample potential. Oscar Onyeama, CEO of Nigerian Stock Exchange, made the following statement about the declining price of oil’s impact on Nigeria’s economy: The effects of the declining oil prices can be felt in nearly all areas of our national life; from the pressure on the naira, which has led to the central bank of Nigeria’s spending over $4.7 billion to defend the national currency, through the impact on the capital markets with foreign investors taking a wait and see attitude in the last couple of months, to federal government budget deficits. While the decrease in oil prices has certainly put a strain on Nigeria’s economy, there is certainly growth and attractive valuation to be found in other industries. The Global X MSCI Nigeria ETF (NYSEARCA: NGE ) is an excellent way to gain exposure to Nigeria, has a wide variety of industries developing outside of the oil industry. Its current valuation is among the lowest of ETFs in Asia and Africa, and has substantial growth ahead of it. Investors who are willing to take the risks associated with geopolitics and the country’s dependency on oil prices, will be rewarded with the fund’s low valuation and high growth potential. While general exposure to Africa, through AFK, is the most conservative endeavor for investors, specifically identifying opportunities in Nigeria provides the opportunity for higher returns, by taking advantage of the fund’s current low valuation; it currently has a P/E of 9. Conclusion The Market Vectors Africa Index ETF is an excellent means for investors to gain exposure to Africa, due to its diversified holdings and low valuation. Investors who prefer a higher risk and less diversified investment approach, should strongly consider the Global X MSCI Nigeria ETF. Both funds have received an undeserved drop in price, and present an excellent buy opportunity for investors with a long term vision for Africa’s growth. Disclosure: I/we have no positions in any stocks mentioned, and no plans to initiate any positions within the next 72 hours. (More…) I wrote this article myself, and it expresses my own opinions. I am not receiving compensation for it (other than from Seeking Alpha). I have no business relationship with any company whose stock is mentioned in this article.