It’s August 13, 2015 – Do You Know What’s In Your International ETF?
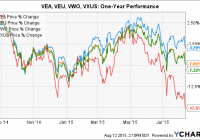
Summary Investors desiring true diversification do well to have some international exposure in their portfolio. However, not all “general” international ETFs are the same, not by a long shot. Knowing what is in your ETF is crucial to making correct decisions, in line with your investment viewpoint and strategy. At least some of my readers may well remember a Public Service Announcement that ran during the 1960s, ’70s, and ’80s according to Time magazine . The question was: ” It’s 10 p.m. Do you know where your children are? ” Historically, this was not simply a general reminder to parents but also due to the fact that curfews were in place in various areas due to riots and other public unrest. A failure to know where one’s children were could lead to complications for the family. When investing, clearly it is beneficial to know what you are investing in. It’s not so much a question of what your strategy is , but rather knowing if the vehicles you have chosen to implement that strategy are actually doing so. All International ETFs Are Not Created Equal As I have suggested previously , every investor should consider holding at least some percentage of foreign stocks in their portfolio. Put simply, such exposure can provide both diversification and the potential for greater growth as compared to a portfolio comprised solely of U.S. stocks. But back to the heading of this section; Not all international ETFs are created equal. For purposes of this article, I am hoping to encourage you to evaluate what, at least in broad terms, is in your international portfolio; to make sure it is actually what you think is in your portfolio. In this article, we will consider that topic using four Vanguard international ETFs that I will describe as “general;” in other words they are not country or even region-specific (e.g. Asia or Europe). Those ETFs are: Vanguard FTSE Developed Markets ETF (NYSEARCA: VEA ) Vanguard FTSE All-World ex-US ETF (NYSEARCA: VEU ) Vanguard Total International Stock ETF (NASDAQ: VXUS ) Vanguard FTSE Emerging Markets ETF (NYSEARCA: VWO ) To get us started, please take a look at the following table, where I have summarized some key data points featuring the sorts of things you may wish to evaluate. VEA, VEU, VXUS, VWO: Comparison of Key Data Points ETF Index Tracked AUM (in $ billions) # of Holdings Expense Ratio Exposure to China VEA FTSE Developed ex North America 52.1 1,398 .09% 0.0% VEU FTSE All-World ex US 25.5 2,490 .14% 5.4% VXUS FTSE Global All Cap ex US 168.4 5,904 .14% 5.2% VWO FTSE Emerging 65.4 1,022 .15% 28.3% If you have read some of my other articles, you probably already know where I am headed with most of the data points I selected. The expense ratio is certainly important since, the lower it is, the closer your ETF will track its selected index and the more money will flow to your pockets. The Assets Under Management (AUM) will affect how liquid the fund is, and the number of holdings gives you some idea how well-diversified the fund is. I’d like, however, to talk about a somewhat random data point I threw in; Exposure to China . As you may be aware, the Chinese stock market has experienced some sharp declines of late. As you can quickly see from the table, the effect of this on our four ETFs ranges from “none at all” for VEA to “quite significant” for VWO. Looking backwards, if one owned VWO and was not aware of this, its recent performance may have come as a shock. Looking forwards, however, VWO may be exactly the ETF you wish to get into, or add to your position in, if you wish to gain some exposure to a possible recovery. With that background, let’s next turn to a one-year chart of the recent performance of each of our four ETFs. VEA data by YCharts No doubt, your eye was immediately drawn to that 17.5% decline in VWO. Without a doubt, this past year has been very challenging for emerging economies. Hopefully, investors with shares in VWO understood this potential and had it weighted appropriately in their portfolios. But the second thing you likely notice is that our 3 other ETFs were affected to very different degrees by this. VEA, which sticks purely to developed markets, has dropped a relatively modest 3.29% over that same period, while both VEU and VXUS were somewhere in between. Let’s now take a quick look at each of the 4 ETFs and how investors may choose among them. In each case, I will make the title of the section a link to that ETF’s fact sheet, in case you wish to examine one or more further. Vanguard FTSE Developed Markets ETF Put simply, as reflected in the name of the index it tracks, this ETF sticks strictly to developed markets outside North America. Please see this article for more definition around the differences between developed and emerging markets. NOTE: Vanguard recently announced that VEA will transition from the FTSE Developed ex North America Index to the FTSE Developed All Cap ex US Index . This is actually sort of a big deal. Currently, this ETF has no exposure to Canada, which could be a negative factor for some investors. This change will correct that, including 234 Canadian stocks and offering exposure to a country rich in natural resources. Of the four, at .09% VEA has easily the lowest expense ratio; extremely low for an ETF investing outside the U.S. At $52.1 billion of AUM, it is a huge fund, offering wonderful liquidity and a tight trading spread of .02%. Over the past 12 months, its distribution yield (distributions over the past 12 months divided by the fund’s Net Asset Value) has been 2.83%. VEA is a wonderful option for the investor who wishes to stay completely away from the volatility of emerging markets. Alternatively, it can be mated with VWO to introduce exposure to emerging markets at whatever level the investor desires, as opposed to the defined exposure offered by VEU and VXUS. Vanguard FTSE All-World ex-US ETF and Vanguard Total International Stock ETF I am going to consider both of these together because there are many similarities between the two. Their expense ratios are the same, at .14%. Their Top 10 holdings are the same. Their exposure to emerging markets is roughly the same; 19.00% for VEU and 18.90% for VXUS. Their exposure to China, which I featured earlier, is also roughly the same. Of the two, VXUS has slightly more exposure to Canada. What, then, is the main difference? Have a look back at our comparative table. You will notice that VEU has 2,490 holdings vs. VXUS’s much larger number of 5,904. This is because the index VEU tracks sticks mostly to large and mid-cap companies, whereas the index VXUS tracks extends all the way down into smaller companies. Interestingly, the differences are a mixed bag. VXUS is almost 7 times the size of VEU in terms of AUM. At the same time, its trading spread is .04% vs. .02% for VEU. As can be seen in the performance chart I featured, VXUS is slightly more volatile due to its inclusion of smaller stocks. VEU comes out slightly ahead in the battle of distribution yields; 2.81% to 2.74%. Really, your decision may come down to two factors: How much exposure you want to Canada (VXUS has 6.6% vs. 5.9% for VEU). Whether you desire the slightly greater growth potential of small stocks in return for potentially greater volatility. Vanguard FTSE Emerging Markets ETF As featured in the previous discussion of VEA, VWO makes a nice complementary ETF to include exposure to emerging markets at whatever level you desire. It is true that you could also add VWO to either VEU or VXUS to weight emerging markets even more heavily. However, the calculation gets a little murkier and you are also losing out on VEA’s wonderful .09% expense ratio. VWO carries an expense ratio of .15% and a distribution yield of 2.82%. NOTE: Vanguard recently announced (see link under VEA) that VWO will transition from the FTSE Emerging Markets Index to the FTSE Emerging Markets All Cap China A Inclusion Index . This will add exposure to China A-Share stocks as well as a much larger number of small-cap stocks. Similar Application Across Other ETF Families Similar concepts can be applied across other ETF families. For example, if you are a Fidelity Brokerage client, you may wish to take advantage of commission-free trading to do something similar with iShares ETFs. I actually built a portfolio doing this in this article on my personal blog. Feel free to have a look to see a similar examination and comparison of the iShares Core MCSI EAFE ETF (NYSEARCA: IEFA ), iShares Core MCSI Total International Stock ETF (NYSEARCA: IXUS ) and iShares Core MCSI Emerging Markets ETF (NYSEARCA: IEMG ). Summary And Conclusion Just as that Public Service Announcement reminded parents of the importance of knowing where their children were in the late-evening, it is important for each investor to understand the contents of their portfolio. Hopefully, using the example of international equities, I have been able to demonstrate why this is the case. Happy investing! Disclosure: I am/we are long VEU, VWO, IXUS. (More…) I wrote this article myself, and it expresses my own opinions. I am not receiving compensation for it (other than from Seeking Alpha). I have no business relationship with any company whose stock is mentioned in this article. Additional disclosure: I am not a registered investment advisor or broker/dealer. Readers are advised that the material contained herein should be used solely for informational purposes, and to consult with their personal tax or financial advisors as to its applicability to their circumstances. Investing involves risk, including the loss of principal.