Tag Archives: management

An International ETF That Has It All (And It’s Cheap)

Investors have widely favored international exchange traded funds over U.S.-focused equivalents this year. The preference has been for developed markets funds even with emerging markets equities trading at compelling discounts. Nearly 18 percent of VXUS’s weight is allocated to emerging markets equities. By Todd Shriber, ETF Professor Investors have widely favored international exchange traded funds over U.S.-focused equivalents this year. Eight of the top 10 asset-gathering ETFs on a year-to-date basis are international ETFs while just one of the 10 worst ETFs in terms of outflows is an international fund. The preference has been for developed markets funds even with emerging markets equities trading at compelling discounts. For investors looking for exposure to both developed and emerging markets under the umbrella of a single fund, there is the Vanguard Total International Stock Index Fund ETF (NASDAQ: VXUS ) . VXUS is up almost 1.6 percent year-to-date, a performance that lags the S&P 500 and other major developed market benchmarks, but one that is also sturdy when considering the weakness in emerging markets stocks. VXUS features nearly 40 countries in its portfolio with weights ranging from 0.1 percent for four nations to 17.6 percent for Japan. VXUS “is dominated by blue-chip multinationals, which during the past few years have benefited from improving productivity, cheap financing, and exposure to faster-growing emerging markets. Most of these firms are in good financial shape. However, now that the U.S. Federal Reserve’s quantitative-easing program has ended, there is uncertainty as to how monetary policy will be managed and how it might ultimately affect global asset prices–especially considering that valuations across most major asset classes appear to be somewhat stretched,” according to a Morningstar research note . Other Advantages VXUS has some other advantages. With its wide-ranging country exposure, VXUS holds nearly 5,900 stocks across all cap spectrums. That is the deep bench strategy that is the hallmark of so many Vanguard ETFs and one that ensures the firm’s broad market ETFs offer investors all-encompassing or close to all-encompassing exposure to a region or regions. Even when adding up a popular, diversified developed markets ETF with an equivalent emerging markets fund, investors would find it difficult to get exposure to nearly 5,900 stocks. Nearly 18 percent of VXUS’s weight is allocated to emerging markets equities. The ETF tracks an index from FTSE Russell, which classifies South Korea as a developed market. Asia’s fourth-largest economy is 2.9 percent of VXUS. Another VXUS perk, and it is one Vanguard investors are familiar with, is a low expense ratio. VXUS charges just 0.14 percent per year, or $14 per $10,000 invested. Europe looms large in VXUS with developed and emerging European countries combining for over 47 percent of the ETF’s weight. “At this time, the European Central Bank is doing whatever it can to preserve the European Union and prevent the eurozone from going into a deflationary spiral. During the past few years, European equities, as measured by the MSCI Europe Index, have recovered from 2012 lows. However, this rally was muted for investors in this fund because of the falling euro against the U.S. dollar. The MSCI Europe Index, in U.S. dollars, returned 7.6% in the two-year period through July 2015; in local currencies, the index returned 13.2%,” said Morningstar. Disclaimer: Neither Benzinga nor its staff recommend that you buy, sell, or hold any security. We do not offer investment advice, personalized or otherwise. Benzinga recommends that you conduct your own due diligence and consult a certified financial professional for personalized advice about your financial situation. Disclosure: I/we have no positions in any stocks mentioned, and no plans to initiate any positions within the next 72 hours. (More…) I wrote this article myself, and it expresses my own opinions. I am not receiving compensation for it. I have no business relationship with any company whose stock is mentioned in this article.

Momentum Model Recommends Investors Move To Cash

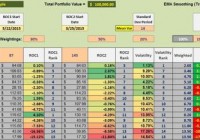
The momentum model currently recommends investing in SHY or a money market. This model outperforms the VTTVX benchmark. The momentum model also minimizes draw-down. Dual Momentum as well as other momentum models are receiving considerable attention as the momentum anomaly appears to have significant staying power. In the following ETF ranking table and the performance graph, this momentum model demonstrates how one can generate benchmark beating returns while lowering portfolio volatility. The following data table is made up of fourteen ETFs that provide global diversification. ETFs used in this example are also found in the Baker’s Dozen article with one addition, BIV, an intermediate bond fund. The fourteen ETFs are: VTI , VEA , VWO , VNQ , RWX , TIP , TLT , DBC , GLD , PCY , BIV , VOE , VBR , and SHY . This array of ETFs covers the U.S. Equities market, developed international equities, emerging market equities, U.S. REITs, international REITs, bonds, gold, commodities, and treasuries. VOE and VBR are included to take advantage of any value anomaly, should it exist. ETF Rankings: Driving the following rankings are three metrics. Performance over the past 87 calendar days. A 30% weight is assigned to this performance percentage. Performance over the past 145 calendar days where a 50% weight is assigned to this performance percentage. Low volatility is an advantage so a 20% weight is assigned to a mean-variance of 14 calendar days. Based on extensive back-testing and out-of-sample analysis, the above variables provided the best return/volatility ratio. An example of such testing is provided in the second screen-shot. As of 8/17/2015, this momentum model recommends investing 100% of the portfolio in SHY as there are no ETFs outperforming this 1-3 yr. treasury bond. Looking for ETFs that are outperforming SHY is an application of the absolute momentum principle where one does not invest in ETFs if they are under-performing the cutoff or circuit breaker ETF. SHY is that cutoff ETF. (click to enlarge) Performance Data: A frequent question is – how well does such a momentum oriented portfolio perform? Since one set of data or one back-test is insufficient to come to any conclusions, a Monte Carlo analysis is run on this set of ETFs. The portfolio is reviewed every 33 days. We are looking for ETFs that are ranked above SHY (none are in the current ranking) and if there are two, we invest equal amounts in those two securities. Should there be a tie, we invest equal amounts in the top three. ETFs under-performing SHY are sold out of the portfolio. The look-back periods are 87 and 145 calendar days as mentioned above. Beginning on 6/30/2006 we capture two bull markets and a severe bear market. The overall return of the portfolio managed using this momentum model is 287% while the VTTVX benchmark is 78%. Draw-downs (“DDs”) are always of interest and here again the momentum portfolio shines by limiting the maximum DD to 24.1% while the benchmark had a maximum DD of 27%. The average DD for the momentum portfolio was an acceptable 10.4%. The light colored or gray graphs show the 50 runs made for this set of ETFs operating under the stated guidelines. The dark line is the average. Even the worst performing run outperformed the benchmark. Not only does the momentum model provide protection against deep bear markets such as we experienced in 2008 and early 2009, the portfolio also shows a much steeper slope during the bull market since March of 2009. The above momentum model was not selected to generate the very best return. Instead, it was built to be a robust portfolio in all types of conditions. Using SHY as the circuit breaker is our volatility check and should keep one away from the depths of a bear market. The model does require discipline as one needs to review the portfolio every 33 days. The above graph shows the benefits of such discipline. Disclosure: I am/we are long VTI,SHY. (More…) I wrote this article myself, and it expresses my own opinions. I am not receiving compensation for it (other than from Seeking Alpha). I have no business relationship with any company whose stock is mentioned in this article. Additional disclosure: The back-test runs were performed by Ernest Stokely.

Correlated Risk? Or Opportunity?

In my weekend research report I write for my clients, I shared a few thoughts on correlation. This is a timely topic-we may be entering a period of the market history where a lot of assets link together. This is a risk, as there’s always the risk of getting smacked in the face when (previously) non-correlated markets snap into lockstep, but there’s another side to this, as well. Correlated risk can drive exceptional performance, for those traders who understand the risks, can fully accept those risks, and manage them appropriately. Here’s the snippet I wrote over the weekend: (click to enlarge) Correlation is a concept that is often misunderstood and much-abused in thinking and writing about financial markets. This week, we need to devote a few words to the concept of correlated risk and how to manage these risks, but, first, a few thoughts on correlation and some potential issues with the measure: Think carefully Correlation is well-understood mathematical measure, but, as in so many cases, applications to financial markets can often encourage sloppy thinking. On one hand, perhaps too much attention is focused on correlation, and this is likely a side effect of correlation’s importance in constructing portfolios; expected future correlation of assets is one of the key inputs in portfolio models, and here we arrive at one of the first issues. Few people, outside of those who have done quantitative work and study on financial market data, appreciate how variable correlations can be. Stocks are put into portfolios with the idea that they are “high beta” or “low beta” (beta is a measure of the amount of a stock’s movement that is attributable to the broad market), but, depending on what time window we measure, a stock’s beta might fluctuation between 2.0 and -1.0 within the course of a few years. Even supposedly well-established rules of thumb, such as the Dollar’s correlation to other asset prices, stock markets’ volatility’s (inverse) correlation to price movements, are highly variable. Furthermore, correlation does not show what most casual market participants might expect. It is easy to look at two lines on the chart that go in roughly the same direction and say “they must be highly correlated.” Maybe, but maybe not. Correlation can be highly deceptive when extrapolated to other time periods; it is trivial, for instance, to construct two price series that are perfectly -1.0 inversely correlated, yet both “go up” over a longer time period. (See this blog post for an example.) Last, two points that will be familiar to readers with a mathematical background, but that bear repeating: correlation does not imply causation. Every statistics student learns this in the first class she takes, but we are all vulnerable to drawing unsupportable conclusions in the heat of battle; we cannot hear this reminder too often. Second, correlation measures linear relationships. In many cases, linear correlation has application to non-linear relationships, but just be aware that relationships between markets could potentially be much richer and more complex than could be captured in a measure of correlation. Correlated portfolio risk These points are interesting (and important), but the practical issue of correlated risk demands attention. Put very simply, we put on different positions in a trading book or portfolio with the idea that they are all independent bets-some may win, some may lose, but they will each “do their own thing.” Correlated risk is the risk that, for some reason, all of these positions move in the same direction at the same time. Why might this happen? It is well-established, through decades of market history, that correlations tend to move toward 1.0 in times of market stress . These are not rare events; they happen several times each decade when supposedly unconnected assets all move in the same direction, usually led by mini-crashes in stock prices. In retrospect, there’s always some “obvious” connection, but psychology is the driver. Market participants become scared and basically scramble for the exits all at the same time. However, risk is a double-edged sword, and one of those edges works for us. Risk is the companion of opportunity, and, in fact, we can reduce our job to taking on the right kinds of risk and managing them appropriately. Over a long period of time, many traders find that their returns tend to be concentrated in certain time periods; this is true both of discretionary traders and of trading systems in test and design. During these periods, risks tend to high and correlated, but there is an important lesson here. Accepting these correlated risks can lead to outsized returns. We may wish it were otherwise, but trading and investing are uncertain games of chance. We may wish for steady returns and a rising equity curve that looks like a straight line (or an exponential curve), but reality is messier. Reality is periods of feast and famine, and correlated risks typically are high in the rich periods. We should be aware of these risks and manage them, but we should see them for what they are-a real risk with real potential rewards and, potentially, a major driver of potential outperformance.