Tag Archives: management

4 Small-Cap ETFs For A Bumpy Japan Ride

Japan has been on an uneven recovery path with wild fluctuations seen in recent quarters. This is especially true as the country lost its momentum yet again, snapping two quarters of expansion. The economy contracted 1.6% year over year in the second quarter compared to a solid 4.5% growth in the first quarter. However, this is slightly better than the market expectation of a 1.8% decline. A drop in consumer spending, weak exports and lower private consumption continued to weigh on the growth of the world’s third-largest economy. The slump in Japan’s biggest trading partner – China – added to the woes. The slowdown seems to be a major setback for Prime Minister Shinzo Abe and his reform policy – Abenomics – which is aimed at pulling the country out of two decades of deflationary pressure and returning to growth. More Stimulus in the Cards? Sluggish growth has raised speculations of additional monetary and fiscal stimulus by the central bank later in the year to boost growth. Earlier this month, Bank of Japan (BoJ) announced that it is seeking expansion in its massive asset purchase at 80 trillion yen per year if lower oil prices continue to hold back inflation at a near-zero level. The bank recently cut its annual growth outlook to 1.7% from 2% and inflation to 0.7% from 0.8% for this year. However, many economists believe that the slowdown in the second quarter was because of temporary factors, mainly the China turmoil, and that the Japanese economy will return to growth in the ongoing quarter. According to Capital Economics, Japan will return to a modest growth in the third quarter and see 1% growth for the full year. Further, as per the survey by the Japan Center for Economic Research, 40 analysts project that growth would rebound by an average 2.5% in the third quarter. This could be easily depicted in the solid manufacturing PMI data, which showed that business activity expanded in July with broad-based improvement in output, new orders, employment and exports. Notably, the PMI index climbed to 51.2 in July from 50.1 in June. Exports recovered in July on cheap yen. This is because Japan is primarily an export-oriented economy and a weaker currency makes its exports more competitive. Rise in exports and hopes of further stimulus measures would boost the stock prices in the coming months. While the rally will likely take place across various market spectrums, small caps will benefit the most, as these are less vulnerable to China’s uncertainty or any other external threat. Below, we take a look at four ETFs, which track the small-cap segment of the Japanese stock market. All of these funds offer access to pint-sized securities in the nation. These are likely to see higher volatility yet deliver better returns if the Japanese economy trends in the right direction. WisdomTree Japan SmallCap Dividend Fund (NYSEARCA: DFJ ) This fund targets the dividend-paying small-cap stocks by tracking the WisdomTree Japan SmallCap Dividend Index. Holding 598 securities in its basket, it has a spread out exposure to various components as each firm holds less than 0.9% of total assets. From a sector look, industrials and consumer discretionary take the top two spots with one-fourth share each, while materials, financials and information technology round off the next three with double-digit allocation each. The product has amassed $335 million in its asset base while trades in a lower volume of under 36,000 shares. It charges an annual fee of 58 bps and has gained about 2.4% over the past three months. The fund has a Zacks ETF Rank of 2 or ‘Buy’ rating with a Medium risk outlook. iShares MSCI Japan Small-Cap ETF (NYSEARCA: SCJ ) This fund follows the MSCI Japan Small Cap Index and holds 798 stocks in its basket. It is widely spread out across components with none holding more than 0.86% of assets. However, about one-fourth of the portfolio is allotted to industrials, closely followed by financials (18.7%) and consumer discretionary (18.2%). The fund has managed AUM of $339 million while sees lower average daily volume of around 38,000 shares. Expense ratio came in at 0.48%. The fund has added 1.7% over the past three months and has a Zacks ETF Rank of 2 with a Medium risk outlook. SPDR Russell/Nomura Small Cap Japan ETF (NYSEARCA: JSC ) This is the illiquid and unpopular ETF in the Japanese space with AUM of $66.3 million and average daily volume of just 3,000 shares per day. It tracks the Russell/Nomura Japan Small Cap Index, charging investors 40 bps in annual fees. In total, the fund holds well-diversified 692 securities in its basket with none accounting for more than 0.61% of assets. Here again, industrials make up for the top sector at 26.1%, closely followed by consumer discretionary (21.3%). The product is up 2.6% over the trailing three-month period and has a Zacks ETF Rank of 2 with a Medium risk outlook. WisdomTree Japan Hedged SmallCap Equity Fund (NASDAQ: DXJS ) DXJS offers exposure to the Japanese small-cap stocks while at the same time provides hedge against any fall in the Japanese yen. This is easily done by tracking the WisdomTree Japan Hedged SmallCap Equity Index. The fund has accumulated $207 million in its asset base and charges 58 bps in fees per year from investors. Volume is moderate as it exchanges 61,000 shares in hand per day on average. The product holds 619 stocks in its basket with none accounting for more than 0.94% of assets. Industrials and consumer discretionary and industrials take the top two spots with at least 24% share each, while materials, finance and information technology round off the top five. The ETF gained 6.7% in the same period. Bottom Line These small cap Japan ETFs hit a new 52-week high last week and are clearly outpacing the broad fund (NYSEARCA: EWJ ). Given the China turmoil and global growth concerns, these funds seem safer choices to play the recovering Japanese economy. Original Post
Fragile Five EMs Redefined? ETFs To Watch

Taper tantrums were heard all over the emerging markets in 2013, especially in the “Fragile Five” countries. These countries – Brazil, Turkey, India, Indonesia and South Africa – were then hugely reliant on foreign capital to finance their external deficits, which put these at risk post QE exit by the Fed. This was because the end of the cheap-dollar era had led to an uproar in these markets, with their currencies plunging to multi-year lows. The widening current account deficit and worsening external debt conditions were the main headaches of the pack. Moreover, most of these nations had some structural problems of their own, which added to this turbulence. However, more than two years have passed since then, and several changes – mainly political – have taken place in those countries. While a shift in political power and pro-growth reformative changes boosted India in the mean time, the changes in Indonesia are yet to reap returns. Meanwhile, India and Brazil managed to shrug off these risks to a large extent, while Colombia and Mexico have entered this vulnerable bunch. These two have joined other three laggards, namely Indonesia, Turkey and South Africa, to form a new Fragile Five emerging market bloc, per JPMorgan Asset Management. What Pushed India and Brazil Out of the Fragile League? India has been able to reduce its current account deficit to 1.4% of GDP from 5% in 2013, the steepest cutback by any major emerging market, per Bloomberg . While Brazil has not been successful on this front, as the commodity market crash restrained the economy to excel on this current account metric, the country offers foreign investors the highest interest rates. Notably, foreign investors park their money in the riskier emerging market bloc for higher yields. Brazil’s real cost of borrowing is the highest among the world’s leading emerging markets. This might keep the flair for Brazil investing still alive among some yield-hungry investors, despite the fast-deteriorating fundamentals of the economy. Coming to the ETF exposure, all Brazil ETFs were in deep red this year, losing more or less 30% each. Only one fund, the Deutsche X-trackers MSCI Brazil Hedged Equity ETF (NYSEARCA: DBBR ), lost 10% due to its currency-hedged technique. However, India ETFs appear steadier, with exchange-traded products swinging between profits and losses. Highest gains of 7.6% were accumulated this year by the EGShares India Consumer ETF (NYSEARCA: INCO ). DBBR has a Zacks ETF Rank #3 (Hold), while INCO has a Zacks ETF Rank #1 (Strong Buy). What Brought Mexico and Colombia In? The second-largest economy of Latin America, Mexico was fated for a downtrend mainly due to the oil price rout. Oil revenue makes up about a third of the Mexican government’s revenues. This, coupled with the recent strength in the greenback caused an extreme upheaval in Mexican peso recently and led the currency toward its lowest close on record in early August. The Mexican peso fell about 3.7% in the last one month (as of August 13, 2015). On August 12, the country’s central bank lowered its 2015 economic growth outlook to the range of 1.7-2.5% from 2-3% to reflect lower-than-expected export and reduced oil output. Due to the low inflation, Mexico’s interest rate is also low at 3%, way low from an EM perspective. As per J.P. Morgan, the economy’s real interest rate hovers around zero which leaves no way out for the government to ease the monetary policy further and quicken the economy. In short, low yield opportunity fails to lure investors toward Mexico. Mexico ETFs were moderately beaten up in the early part of this year, but crashed in the last one-month phase, with the Deutsche X-trackers MSCI Mexico Hedged Equity ETF (NYSEARCA: DBMX ), the iShares MSCI Mexico Capped ETF (NYSEARCA: EWW ) and the SPDR MSCI Mexico Quality Mix ETF (NYSEARCA: QMEX ) all losing in the range of 3.5-6%. Thanks to the currency-hedged approach, DBMX lost the least. DBMX has a Zacks ETF Rank #2 (Buy), while EWW has a Zacks ETF Rank #3. Colombia was another victim of the oil crash. Oil accounts for more than half of its exports. As a result, Latin America’s fourth-largest economy was hard hit by a drop in foreign direct investment in the oil sector, which continues to widen the current account deficit. The country’s currency tumbled 25% against the greenback in the last one month. The Colombian peso’s 37% fall in the last one year was the third-worst performance among 151 currencies tracked by Bloomberg . The economy’s 2015 growth will mark the most sluggish pace in six years, and its current account deficit will likely be the widest in three decades, per Bloomberg. Two Colombia ETFs, the Global X MSCI Colombia ETF (NYSEARCA: GXG ) and the iShares MSCI Colombia Capped ETF (NYSEARCA: ICOL ), have lost 30% so far this year, while around 12% losses were incurred in the last one month. Both GXG and ICOL have a Zacks ETF Rank #5 (Strong Sell). Original Post

Vanguard Energy ETF: Should You Take A Dose Of Oil?

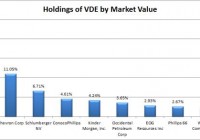
Summary Oil companies seem like a solid natural hedge against higher oil prices and the negative impacts oil prices can have on the economy. VDE has heavy concentration in one company, but I like that holding. The big surprise for me was that high correlation between VDE and the rest of the domestic market. Due to volatility and the high correlation, it appears very difficult to use VDE to reduce total portfolio risk. The low expense ratio is great, but that is not enough to get me to buy into an ETF. When I started looking at the Vanguard Energy ETF (NYSEARCA: VDE ), it looked like a natural fit for my portfolio. The fund is offering diversification while buying up the big oil companies. When it comes to oil, my theory is simple. Holding oil should be a natural hedge to some of the other risks in the economy. When oil prices are doing great, the rest of the economy should be hit by higher gas prices that reduce the amount of capital for consumers to spend at other businesses. The cost of doing business for corporations that rely on physically moving assets should be higher which would compress margins. It is reasonable to assume that VDE should be a great hedge for some of the portfolio risk. I have a bias towards buying high-quality ETFs when I see their prices “dip”. Lately that has been great for me as it has helped me acquire better prices on several of the ETFs I’m holding. On the other hand, if we were to have another major recession where the market fell by 40%, I would’ve been all in by the time the market was down to 5% to 10% and scrambling to get more dry powder to buy more shares when prices were even lower. Largest Holdings The diversification within the ETF is terrible. That sounds like a huge problem, but in this rare case it is not a major issue. If I was going to buy one company to try to hedge against higher oil prices, I would probably pick Exxon Mobil (NYSE: XOM ). That is running around 21% of the portfolio of VDE, as shown below: (click to enlarge) Since XOM is one of the first companies I would want to add to the portfolio, I see VDE as offering diversification for 79% of the investment. From that perspective, the diversification adds a fairly solid benefit relative to only holding one of the major oil producers. When I’m comparing the concentration to the other ETFs I choose, there is no way I would accept so much concentration in any of the other ETFs. Surprises When I ran the statistical analysis over the last 5 years, I was surprised to see the results. I expected oil to appear fairly volatile after the problems the oil market has seen in the last year. Despite expecting some volatility, I wasn’t expecting these results. (click to enlarge) When I ran the ETF through InvestSpy to check the statistics, the high beta stood out to me. I was expecting a lower beta for the ETF, because I thought the correlation would be lower. Instead, using the last 5 years, the correlation was running at 84%. To run some quick math, when the volatility is almost 50% higher than SPY and the correlation is greater than 80%, you’re not going to find any diversification benefits showing up in the statistical analysis relative to just holding SPY. Regardless of how small the weight was for VDE, it would hurt the total portfolio volatility unless the starting portfolio was very strange. To demonstrate that point, I ran a sample portfolio that was 99% Vanguard Total Stock Market ETF (NYSEARCA: VTI ). I use VTI for a substantial portion of my portfolio because I value the diversification. I’m not using it as 99%, but I think this demonstrates precisely the challenge in using VDE. (click to enlarge) When an ETF is only used for 1% of the portfolio, even high levels of volatility can be dealt with by simply diversifying away the risk. However, the high correlation between VDE and the domestic U.S. market is preventing it from gaining those benefits. Double Dipping on Exposure The simplest argument for VDE having such a high correlation with the total stock market ETF and with the S&P 500 would be that XOM is already an enormous company and thus it is influencing both ETFs. However, the problem with that argument is that XOM is only 1.53% of the VTI portfolio. Expense Ratio The expense ratio is only .12%, which is a good reasonable ratio. Unfortunately, a low expense ratio is not enough by itself to get me to invest in a fund. Conclusion I like the idea of increasing my oil exposure and regularly rebalancing the position after seeing how far some of the sector has fallen. Despite that desire, the combination of volatility and correlation makes it much harder for me to justify using a heavy exposure to the sector. Perhaps I need to measure the returns over longer sample periods such as quarters at a time to test for lower correlation levels. That might reduce the correlation of returns, and I’m more likely to assess the performance of my portfolio on a monthly or quarterly basis. I look for opportunities to invest more often than that, but I don’t want to sweat minor changes. Disclosure: I am/we are long VTI. (More…) I wrote this article myself, and it expresses my own opinions. I am not receiving compensation for it (other than from Seeking Alpha). I have no business relationship with any company whose stock is mentioned in this article. Additional disclosure: Information in this article represents the opinion of the analyst. All statements are represented as opinions, rather than facts, and should not be construed as advice to buy or sell a security. Ratings of “outperform” and “underperform” reflect the analyst’s estimation of a divergence between the market value for a security and the price that would be appropriate given the potential for risks and returns relative to other securities. The analyst does not know your particular objectives for returns or constraints upon investing. All investors are encouraged to do their own research before making any investment decision. Information is regularly obtained from Yahoo Finance, Google Finance, and SEC Database. If Yahoo, Google, or the SEC database contained faulty or old information it could be incorporated into my analysis.