Tag Archives: management

How I Dodged A -69.3% Bullet With A Checklist And 3 Important Lessons To Take Away
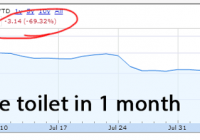
Summary SFX Entertainment has terminated their going private bid. The warnings signs that made me stay away. An updated checklist to avoid these types of situations. Phew. By learning from past mistakes, sticking with experience and following solid advice from books and gurus, it all helped me dodge a -69.3% bullet. Here’s what I mean. At the end of June, I wrote about a special situation involving SFX Entertainment (NASDAQ: SFXE ) where the founder was aiming to take his company private. And here’s what happened. (It was just announced that the deal has now been terminated dropping a further 20% making it -74.6% as of today.) The spread when I first looked at it was at 14%. A spread greater than 10% shows that the market doesn’t fully trust the deal. I know from a few painful experiences where I focused too much on the upside and bit off a big position, only to see the deal get canceled at the last moment. The deal for SFX Entertainment hasn’t been canceled. However, the go shop period has been extended, the buyout offer is to likely to be lowered and the company doesn’t provide enough information to investors. The special committee and its advisors will entertain offers for the entire Company as well as assets not central to the Company’s core business through at least October 2, 2015. Sillerman has agreed to cooperate with the special committee to obtain the best available offer for the Company’s shareholders. The October 2 date was chosen to allow potential bidders and their financing sources to have visibility into the Company’s performance during its peak festival season, thus providing a full and accurate picture of the Company’s results and prospects. To facilitate potential offers during this period, all “no-shop” restrictions and the related breakup fees provisions applicable to the Company under the merger agreement will no longer apply, enabling potential bidders to freely evaluate the Company in light of the recent substantial decline in its share price. Any new transaction will be evidenced by a new definitive agreement as the existing merger agreement is no longer effective. – Source No wonder it’s down so much in a little more than a month. They don’t all end up like this though. There have been plenty of going private acquisitions with a wide spread that went through successfully. Buffett has said that missing out on opportunities was been one of his biggest mistakes. If that’s the case, then dodging blowups like this is a huge success. But how? Simple. Using a checklist like this saved my bacon. Make sure both parties have done their due diligence – Pass Financing and regulator approval is complete – Pass (now a Fail) Get preliminary shareholder sentiment or controlling shareholder approval – Uncertain Obtain regulator (SEC, FCC, any and all) approval – N/A Get final shareholder approval at a meeting called for that purpose – TBD Check to see that insiders are continually vesting or buying shares – Pass On the surface, there are more passes than fails for SFXE, but because the importance increases as I move down the checklist. Number 6 was the big hold up. Without a clear green light by all shareholders, management and the special committee, it’s risky to put money down. Additional Criteria to be Added to the Checklist Based on the events that took place, I’m adding a couple of new checks to my checklist. Is management trustworthy? Is the upside and downside risk asymmetric? Is Management Trustworthy? There are plenty of managers that execute like a surgeon. But with SFXE, there are warning flags visible in the way the company is managed and how it communicates to investors. Plus, when a CEO publicly flips the bird and grabs his crotch , I tend to lose trust in their actions and judgment. Management should also have a history of doing what they say. There are a lot of managers who are showman types. After all, they are the face of the company and it is their job to sell, sell, sell. A method to check this is by comparing a few annual letters. Go through and highlight what they say they will do, and check the following letters to see whether it was accomplished, or whether it shows up in the numbers. The numbers won’t lie. Is the Upside Downside Risk Asymmetric? Special situations operate on a timeline, usually within a year. Due to a short time frame, the tradeoff is that your profit potential is small. So it makes it even more important to go after the high certainty opportunities and ignore the ones with bad odds. It’s a lot safer and easier to go after a very highly certain 1-2% return in a month using a large amount of money, compared to using a small amount of money for the 10% uncertain ones. When Google (NASDAQ: GOOG ) (NASDAQ: GOOGL ) announced in 2912 that it was buying Motorola Mobility, the spread was a little under 2% at the time. I put down a large amount of cash to maximize my returns over a very short period in order to make up for the small profit potential. Keep doing this with the good ones and you’ll build up your returns. Buffett didn’t achieve 30% annually during his prime by simply assigning a massive portion of this portfolio to Coca Cola (NYSE: KO ) and American Express (NYSE: AXP ) and then sitting on it. No. He spent a lot of his time on special situations and other active areas to increase his returns one brick at a time. The Updated Special Situations Checklist OK. Adding the two new checks, here’s the updated checklist I’ll be using for special situations going forward. Make sure both parties have done their due diligence Check management of both parties are trustworthy (NEW) Financing and regulator approval is complete Get preliminary shareholder sentiment or controlling shareholder approval Obtain regulator (SEC, FCC, any and all) approval Get final shareholder approval at a meeting called for that purpose Check to see that insiders are continually vesting or buying shares Verify upside and downside risk is asymmetric by assigning potential upside to downside returns (NEW) 3 Important Lessons to Take Away This year, it seems like I’m parroting the same thing, but the lessons I got from SFXE is clear. 1. It’s more important to focus on protecting the downside I didn’t like the 14% upside versus 24% downside. Seeing the stock price now, you can see how the downside turned out to be larger. 2. Don’t get greedy Even if you did go long SFXE, if you kept it to a small position, less than 1% of your portfolio, it didn’t damage your returns or portfolio compoundability. Losing money is bad because it makes it harder for your money to work because you’re chopping it off at its knees. I said earlier that I put a large amount into the Motorola merger, but that was because it was a highly certain transaction with very little possibility of failure. But I didn’t sell my other positions to free up cash to go all in. I used what was available and didn’t put in more than what made sense. 3. Manage risk The best investors and traders have one thing in common. They are obsessed with minimizing risk by going after asymmetric bets and taking advantage of inefficiencies. This may sound similar to points 1 and 2, but managing risk involves position sizing, seeing how things fit in your portfolio, being emotionless, not falling for obvious behavioral fallacies, being able to cut losses, admitting faults and more. But for the purpose of this article, adjust your sizing based on the odds and don’t overdo it. Disclosure: I/we have no positions in any stocks mentioned, and no plans to initiate any positions within the next 72 hours. (More…) I wrote this article myself, and it expresses my own opinions. I am not receiving compensation for it. I have no business relationship with any company whose stock is mentioned in this article.

How I Diversify And Hedge My Portfolio For Market Volatility

Wide diversification and a ‘buy and hold’ strategy are not necessary for success. In fact, there are much better ways to hedge the market, capitalize on upside, and protect yourself from downside. Here is how I diversify my portfolio. Wide diversification is only required when investors do not understand what they are doing.” – Warren Buffett Every couple weeks I list my portfolio along with top-rated stocks to members of Tipping the Scale. I do this because my holdings often change depending on stock gains, valuation, and when new opportunities arise. Soon after my last update, a person noted that I did not own any materials, utilities, and was very light on industrial stocks and ETFs. He continued that for a portfolio of my size, he was surprised I did not prioritize “diversification”. My response is that I do diversify, just differently, and that my intention is not to track the market, but to rather beat the market. With well over a decade of consistency, my bottom line approach has not changed much, having worked very well in all markets. Here’s what I do. Rather than prioritizing industries and sectors of the market to achieve diversification, I diversify by purpose. Each holding in my portfolio fits into one of five categories, my sectors if you will, and thereby having a purpose. That category dictates management style, selection, and activity. Here are the five categories and the weight that each has in my portfolio Category Weight Top rated stocks 35% Dividend & Income Stocks 30% Deep Value 10% Growth & Momentum 5% Cash 20% Top-rated stocks are those that score in the upper echelon of companies covered in Tipping The Scale. Typically these are stock that score 88 or higher, meaning the company had to score relatively high in all 10 categories that TTS tracks. These include business growth, macro outlook, profitability, management vision, valuation, etc. Due to such a high rating, my theory is that “top-rated stocks” are worth holding through volatility, and should not be sold, only acquired in periods of loss until the company’s rating starts to decline. In the first three months of TTS, top-rated stocks (seven stocks with a score better than 90) traded higher by more than 9% versus a loss of 1% in the S&P 500. Therefore, these stocks tend to perform well both in short and long term, which is why they are such a staple in my portfolio. For investors considering my portfolio strategy, 35% of your holdings would be allocated to those stocks where you have the most confidence, and are the best of the best, however it is that you determine “the best”. Dividend And Income stocks provide some balance to my portfolio, as these are typically low beta, safe investments. Seeing as how 40 of the potential 100 points for TTS stocks are tied to business growth, macro outlook, and the amount of short and long-term upside in a stock, large companies with high dividends don’t typically rank as “top rated stocks”. Therefore, I hedge those types of investments with stocks that don’t necessarily have tons of upside or growth (i.e. AT&T (NYSE: T ) or Corning (NYSE: GLW )) but have high yields. These are companies that would rank high in other areas, but just don’t have the growth upside of a top-rated stock. Furthermore, this is where I put REITs like the Vanguard REIT Index Fund (NYSEARCA: VNQ ) and ETFs that have high yields. The key with the dividend and income section is to invest in entities that pay a high yield. The average yield of my holdings that fit into this section is 4.6%. With 30% of my portfolio allocated to dividend and income, that 4.6% yield for 30% of my portfolio translates to a 1.4% yield for the entire portfolio. Not to mention, often times a company that pays a dividend will fit into another category, thereby not considered part of the dividend & income section. A good example is Apple (NASDAQ: AAPL ) and Schlumberger (NYSE: SLB ), which fit into the top rated and deep value sections of the portfolio, respectively. All in all, the yield of my total portfolio is 1.8%, just about equal to the SPDR S&P 500 ETF Trust (NYSEARCA: SPY ). That gives me a downside cushion while also hedging my top rated holdings. With that said, the top rated stocks and dividend & income sections serve as a natural hedge against the other, limiting downside risk in the face of a market correction. The Deep Value and Growth And Momentum sections tend to do the same. Albeit, I don’t worry about how many holdings in each sector are in my portfolio, but by allocating my portfolio based on goals, you end up owning stakes in most industries. For example, energy and financial stocks trade at the lowest multiples and are mostly cheap because of macro-related factors, whether it be oil prices or low interest rates. This gives investors an opportunity to cherry pick top companies in those respective industries, those that have fallen below their worth because of macro-related concerns. My belief is that once those macro-related concerns stabilize, those top companies like Schlumberger, EOG Resources, JPMorgan (NYSE: JPM ), and Goldman Sachs (NYSE: GS ) will be the ones to outperform their peers. However, if those macro factors don’t improve, then not much of your portfolio is tied to such stocks. That said, there is certainly no valuation considerations for stocks included in my growth and momentum section. This is where I own companies like FireEye (NASDAQ: FEYE ), Facebook (NASDAQ: FB ), or speculative biotechnology companies. As explained in a recent blog , this is where I trade stocks based on their score in TTS. This is where I buy momentum stocks when volatility makes them cheap, and then sell when that price gets too high. Notably, if the market turns for the worse, these are usually the first stocks to go lower, and that’s why when owning such stocks it is good to keep a close eye and set stern stop-loss and limit orders. Finally, I keep a cash stake that equates to 20% of my total portfolio, which too fluctuates depending on the performance of the market. Believe it or not, cash is where investors can really hedge the performance of the market, and use volatility to their advantage. Below is a chart that I follow as a way to determine the size of my cash stake. Cash as percentage of portfolio S&P 500 performance 15% bull market 20% 2% to 5% off highs 25% 5% to 8% off highs 30% 9% to 12% off highs 35% 13% to 30% off highs 50% 31% or more off highs We are coming off a five year bull market that has seen very little economic growth, one that I fear has been driven by lower interest rates and multiple expansion. I have said on many occasions that I expect a correction. The problem is that there’s no way to know when that correction will come or how bad it will be. So, when the market starts to dip, I start cutting my growth and momentum stocks. If it keeps falling, I will trim value stocks that are hurt by macro conditions. Finally, if the market keeps going lower, surpassing that 30% from market high levels, I will start cutting dividend stocks. However, unless something changes the outlook for those high rated stocks, I will not sell, not until my price target is reached. With that said, this is a hedge that I have found to be very useful over the years. For one, both times that the market has exceeded a loss of 30% off its high since the year 2000, it continued to dip significantly lower. Therefore, I protect myself from future losses, and by quickly increasing my cash position and removing high beta stocks, while retaining low beta stocks (dividend), my portfolio tends to outperform the market. Then, by decreasing cash and increasing my stake in high beta momentum stocks, my gains tend to outperform the broader market as it recovers. However, the final and most important piece of the puzzle are those high rated stocks, because as I already explained, those stocks consistently outperform the market due to having the total package in those 10 essential categories. All things considered, the buy-and-hold, complete diversification strategy by owning all industries of the market is not a bad way to structure a portfolio, but I don’t think it is the best way, and neither does Warren Buffett. Instead, it is best to determine what you want from a portfolio, and then create it from those goals. Over the years, as my net worth has grown larger, I’ll be the first to say that my appetite for risk has diminished, and where I used to own more momentum stocks, I have since found high yield to be most important. However, the one thing that has not changed is my desire to own as many high quality companies as possible. In any market, those are the ones that thrive, and that’s why I would tell anyone to diversify by owning what’s best, and not to own a little piece of everything. Disclosure: I am/we are long AAPL, GS, T, JPM, SLB, GLW. (More…) I wrote this article myself, and it expresses my own opinions. I am not receiving compensation for it (other than from Seeking Alpha). I have no business relationship with any company whose stock is mentioned in this article.

The iShares Exponential Technology ETF Dilutes Exposure With Blue Chips

Summary XT invests in companies developing or using exponential technologies. XT owns many large companies that only have a small exposure to these technologies. Due to blue chip holdings, XT is not as volatile as one might expect from the name, good for conservative investors, but may disappoint those seeking pure plays. The iShares Exponential Technology ETF (NYSEARCA: XT ) seeks to replicate the overall performance, before fees, of the benchmark Morningstar Exponential Technologies Index. This index is comprised of stocks issued by developed and emerging market companies that create and use exponential technologies. Exponential technologies are those which lead to exponential growth, creating entirely new markets where none existed only years before. Most of the companies in this fund use rather than create exponential technologies, which are much rarer. Take a company such as Netflix (NASDAQ: NFLX ), the top holding with 1.22 percent of assets. Netflix uses Internet technology and is riding a wave of technological change, but Netflix didn’t create the technology behind it. Index & Strategy Following the underlying benchmark, XT invests in developed and emerging market companies involved in nine different fields, or themes, which fund managers deem to be “exponential technologies.” These innovative technologies are replacing outdated systems and methodologies. The areas include big data and analytics, bioinformatics, energy and environmental systems, financial services innovation, medicine and neuroscience as well as nanotechnology, networking, robotics and 3-D printing. XT invests at least 80 percent of its assets in securities found in the underlying index. While the fund provides solid exposure to up-and-coming technology companies, such as Illumina (NASDAQ: ILMN ), Splunk (NASDAQ: SPLK ) and Hologic (NASDAQ: HOLX ), it also holds well-established blue chip companies like Airbus (OTCPK: EADSY ), AT&T (NYSE: T ), Boeing (NYSE: BA ), DuPont (NYSE: DD ), Monsanto (NYSE: MON ) and Pfizer (NYSE: PFE ). Those latter firms are unlikely to experience exponential stock price increases because they’re already large blue chip companies. The former firms are more dynamic pure plays on emerging technologies. Illumina develops, manufactures and markets integrated systems that serve the gene expression, sequencing and genotyping industry. Splunk creates software that searches, monitors and analyzes machine-generated big data. Top 10 holding Hologic develops and supplies diagnostic imaging systems related to women’s health. The mix of holdings in XT offers investors the opportunity diversify their portfolios with growth stocks across a wide range of technologies, market caps and geographic locations, but without taking on as much risk as one might expect (and for aggressive investors, want) from a fund with the name “exponential technology.” Index components are scored across individual analysts, sectors and themes. Managers review the scores and collectively select leading candidates for inclusion in the index. Each theme will have one to five leaders. The index is reconstituted annually. At that time, potential candidates for inclusion must have average 3-month trailing daily trading volume in excess of $2 million and a market cap of more than $300 million. Stocks already in the index must have maintained an average 3-month trading volume over $1.5 million and a market cap greater than $200 million. Stocks not meeting these criteria are eliminated from consideration. The remaining qualified candidates are ranked in order of their exposure to exponential technology themes. Managers rank the stocks using specific criteria, such as the number of themes in which the stock is a leader. They also consider the number of themes in which it scores above average and market capitalization with a preference for smaller firms over shares of larger cap names. The 200 highest scoring stocks are included in the index. The ETF’s managers then select and equally weight shares from this index to create the fund’s portfolio. Thus, while XT is technically not an actively managed fund, the selection of components is made by somewhat subjective measures. Portfolio Composition and Holdings XT is a large core growth fund with slightly more than $686 million in assets allocated across 195 individual holdings. The portfolio holds 67 percent of asset in domestic stocks and 31 percent in foreign shares. The fund’s foreign exposure includes Developed and Emerging Europe as well as Developed and Emerging Asia. In addition to the United States, the fund is invested in companies headquartered in the United Kingdom, France, Switzerland and Denmark as well as Canada, Japan, Australia and India. XT holds 27 percent of assets in giant cap stocks along with 40 percent in large caps, 28 percent in mid-cap stocks and 5 percent in small caps. The fund also has a small exposure to micro-cap shares. Compared to the category averages, the ETF is underweight giant caps and overweight large- and mid-cap stocks. XT is heavily weighted towards the technology, health care and telecommunication sectors. The fund’s top 10 holdings comprise 7.9 percent of total assets. These include Netflix , Valeant Pharmaceuticals (NYSE: VRX ), Amazon (NASDAQ: AMZN ), and Seattle Genetics (NASDAQ: SGEN ). While there are many large caps in the portfolio, XT has an average market capitalization of $23.3 billion, which is less than the technology category averages of $40.8 billion. XT shares have a P/E ratio of 20.94 and a price-to-book 2.72. Historical Performance Established in March 2015, XT has generated a 3-month return of 0.26 percent. This compares to the category average of -2.26 percent over the same period. XT has underperformed the Technology Select Sector SPDR ETF (NYSEARCA: XLK ) since inception in March 2015. (click to enlarge) Expenses The fund has a total expense ratio of 0.47 percent, which is less than the category average of 0.57 percent. Dividends Thanks to owning many large blue chips, the fund does pay a dividend. The current 30-day SEC yield is 1.36 percent. Outlook The iShares Exponential Technology Fund provides investors with the opportunity to gain exposure to a niche area of the thriving technology sector. XT is a relatively conservative way to play these companies due to the inclusion of blue chip companies across a range of sectors. Although the fund is equally weighted, its smaller cap components should experience larger gains over the long run. The approach of XT is good for conservative investors if it is successful, but may disappoint aggressive investors looking for pure exposure to innovative, cutting-edge technology companies. Editor’s Note: This article discusses one or more securities that do not trade on a major U.S. exchange. Please be aware of the risks associated with these stocks. Disclosure: I/we have no positions in any stocks mentioned, and no plans to initiate any positions within the next 72 hours. (More…) I wrote this article myself, and it expresses my own opinions. I am not receiving compensation for it (other than from Seeking Alpha). I have no business relationship with any company whose stock is mentioned in this article.