Tag Archives: management

Foreign Funds To Buy On Worst U.S. Funds Outflow Since ’93

Domestic equity-focused funds are facing a tougher time in terms of fund outflows than what they experienced during the financial crisis. According to Morningstar data, US-focused mutual funds and exchange traded funds have seen $78.8 billion worth of outflows in the first seven months of 2015. This is higher than any full-year outflows since 1993. Continued transfers from open-end mutual funds to collective investment trusts at Fidelity triggered much of the outflows. In contrast, investors have poured $179.2 billion in these seven months into funds focused on international equities. This is close to the full-year peak of $201.6 billion recorded in 2013. In response to this outflow, we will pick 3 top-ranked funds for investors interested in foreign mutual funds. Before doing so, let’s look into some other details. US versus International Markets International markets have attracted investors backed by the improving conditions. Greece debt negotiations had been a concern through most of 2015’s first half, but Europe as an investment destination had other attractions. The monetary stimulus plan, for example. China had a great bull bun before it hit a rough patch in June, though. Japan too has been profitable, and the country’s equity funds notched the best gains in first half of 2015. As of July 31, the Standard & Poor’s 500 (.INX) returned 2.2%. In contrast, MSCI EAFE Index had returned 6.5%. Morningstar notes that the consensus opined that the US is in late stages of bull market. Foreign country stocks are said to be cheaper on a fundamental level. Investors are aware of the US and Europe’s “different points in the economic cycle”, which is being revealed in the flows. The fund outflows in 2015 so far has been worse than that of the recession years. Since 2007, the US has witnessed outflows 6 times (including YTD 2015). International equity funds have witnessed outflows only once in 2008. Active versus Passive Fund Flow Inflows into passive funds failed to offset the outflows from the active US equity funds. In July alone, estimated net outflows from US equity funds in July increased to $14.3 billion from $8 billion in June. The active funds saw outflows of over $20 billion in July, while inflows of over $6 billion were recorded on the passive side. Over the last 1-year period, over $158 billion flowed out of active funds, while the passive funds added over $140 billion. Meanwhile, international equity funds saw inflows on both active and passive sides. Active and passive funds added over $3 billion and $18 billion, respectively. Category and Fund Family Performance The foreign large blend category has emerged as the best one. Inflows to this category were higher than those to the other top four categories, says Morningstar. Assets of foreign large blend funds are concentrated in Europe. Along with this, European stock also featured in the top 5 list. So, Europe did prove to be a favorable investment decision in July. As for the laggards, Large Growth , Large Value and Large Blend were the worst losers. These are almost all the representative categories of the US markets. Coming to the fund families, only 3 out of the 10 fund families under the study witnessed inflows on the active side in July. These are american funds SPDR State Street Global Advisors and J.P. Morgan. Meanwhile, Fidelity Investments witnessed the biggest outflows on the active side for both July and the last 1-year period. Again, much of Fidelity’s outflows indicated continued transfers from mutual funds to collective investment trusts. Fidelity witnessed outflows of over $10 billion in July and close to $19 billion over the last 1-year period. Fidelity Contrafund Fund No Load (MUTF: FCNTX ), Fidelity Growth Company Fund No Load (MUTF: FDGRX ) and Fidelity Low-Priced Stock Fund No Load (MUTF: FLPSX ) accounted for outflows of $2.36 billion, $2.1 billion and $1.46 billion in July. Franklin Templeton Investments was also a big loser for both periods, while Vanguard and T. Rowe Price witnessed outflows in July against inflows over the last 1-year period. If we look into 5 of the bottom-flowing active funds, 3 of them are from Fidelity. 3 Non-US Mutual Funds to Buy Morningstar notes that the fund flows indicate investors’ expectations for the future. So, investors looking to buy non-US Equity mutual funds should consider the following funds that either carry a Zacks Mutual Fund Rank #1 or Zacks Mutual Fund Rank #2. Matthews Japan Fund Investor (MUTF: MJFOX ) invests most of its assets in preferred and common stocks of firms located in Japan. The fund may invest in companies of all sizes, but the adviser expects them to be mid- to large-cap firms. MJFOX carries a Zacks Mutual Fund Rank #2. MJFOX has returned 22.9% so far this year, and its one-year return stands at 15.3%. The 3- and 5-year annualized returns are 18.1% and 14%, respectively. The fund carries an annual expense ratio of 1.03%, lower than the category average of 1.43%. MJFOX carries no sales load. Cambiar International Equity Fund Investor (MUTF: CAMIX ) invests a large chunk of its assets in equity securities of medium- to large-cap non-US companies. For greater liquidity and lesser custodial expenses, CAMIX buys American Depositary Receipt listings of foreign firms on the US exchanges instead of buying them on foreign exchanges. CAMIX carries a Zacks Mutual Fund Rank #1. It has returned 12.5% so far this year and its one-year return stands at 7.6%. The 3- and 5-year annualized returns are 12.1% and 10.3%, respectively. CAMIX carries an annual expense ratio of 1.09%, lower than the category average of 1.17%. The fund carries no sales load. Fidelity Overseas Fund No Load (MUTF: FOSFX ) seeks long-term capital growth. It invests a large portion of its assets in non-US securities. Management considers the size of the market in each country and region relative to the size of the world market as a whole. FOSFX invests primarily in common stocks. The fund offers dividends and capital gains annually in December. The Fidelity Overseas fund has returned 4.9% and 8.6% over the year-to-date and 1-year periods. The 3- and 5-year annualized returns are 16.7% and 16.3%. FOSFX, managed by Fidelity, carries an expense ratio of 1.04% as compared to a category average of 1.17%. FOSFX carries no sales load. Original Post

Crisis Alpha: Surprising Ways To Hedge Stock Portfolio Risk

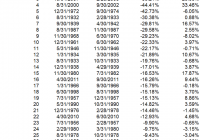
By Wesley R. Gray Investing in the current environment is difficult. Most, if not all, asset classes have high nominal prices, suggesting low nominal expected returns. Not exactly exciting. And for many investors who are retired and/or have near-term liquidity needs, investing in equity exposures – while necessary to generate higher expected returns – also prevents many investors from sleeping at night! One solution to curb the risk of a massive market meltdown is to buy portfolio insurance. However, in a rational world, insurance contracts are expensive because they protect us when we need protection the most. Insurance has this pesky problem of charging a large premium for downside protection. For example, consider put options on the S&P 500 market index. If an investor wants to hedge against a 10% drawdown for a year, the cost (as of August 13, 2015) would be approximately 4% of the notional value to be hedged. So if you had a $1,000,000 stock portfolio and wanted to ensure the most you could lose was $100,000, the cost of that insurance for one year would be around $40,000. Clearly, buying portfolio insurance can be expensive. But what if we could identify unique assets where the cost of insurance was much lower? We’ve identified 3 candidates that may fit this profile: US Treasury Bonds Hedge Fund Factors Managed Futures We highlight some of the historical evidence of the abilities of these assets to provide portfolio insurance (they go way up, when stock markets go way down). Of course, past performance is no guarantee of future performance, and nobody can know what will happen in the future, but the results inspired us to dig a little deeper and think harder about our own portfolio construction efforts. 1. US Treasury Bonds The results below highlight the top 30 drawdowns in the S&P 500 Total Return Index from 1927 to 2013. Results are gross of management fees and transaction costs. All returns are total returns and include the reinvestment of distributions (e.g., dividends). Next to the S&P 500 return is the corresponding total return on the 10-Year (LTR) over the same drawdown period. Bottom line: When the market blows up, flight-to-quality 10-Years have done well. (click to enlarge) The results are hypothetical results and are NOT an indicator of future results and do NOT represent returns that any investor actually attained. Indexes are unmanaged, do not reflect management or trading fees, and one cannot invest directly in an index. Additional information regarding the construction of these results is available upon request. 2. Hedge Fund Factors We examine 3 common hedge fund “factor” portfolios alongside the S&P 500 Index: S&P 500 = S&P 500 Total Return Index HML = The average of 2 value portfolios (small and large) minus the average return of two growth portfolios (again, small and large) MOM = The average of 2 high return portfolios (small and large) minus the average return of two low return portfolios (small and large) QMJ = The average of 2 high-quality portfolios (small and large) minus the average return of two low-quality portfolios (small and large) Results are gross of management fees and transaction costs. All returns are total returns and include the reinvestment of distributions (e.g., dividends). Data are from AQR and Ken French . Next to the S&P 500 return is the corresponding total return on hedge fund factors over the same drawdown period. Bottom line: When the market blows up, hedge fund factors have done well. (click to enlarge) The results are hypothetical results and are NOT an indicator of future results and do NOT represent returns that any investor actually attained. Indexes are unmanaged, do not reflect management or trading fees, and one cannot invest directly in an index. Additional information regarding the construction of these results is available upon request. 3. Managed Futures Here we examine a chart from a white paper by the folks at AQR. The paper is called, “A Century of Evidence on Trend-Following Investing.” The trend-following concept analyzed can be considered a generic managed futures strategy. Bottom line: When the market blows up, trend-following managed futures have done well. (click to enlarge) The results are hypothetical results and are NOT an indicator of future results and do NOT represent returns that any investor actually attained. Indexes are unmanaged, do not reflect management or trading fees, and one cannot invest directly in an index. Additional information regarding the construction of these results is available upon request. Conclusion Historically, Treasury Bonds, Hedge Fund Factors, and Managed Futures have all managed to act like portfolio insurance, even though they aren’t traditionally considered insurance assets. Will this pattern continue in the future? Who knows…and of course, that is the million dollar question… Let us know if you’ve seen other hidden portfolio insurance options out there. Please share ideas… Original Post

Today’s Strongly Competitive Wealth-Builder Sector ETF Investment

Summary From a population of some 350 actively-traded, substantial, and growing ETFs, this is a currently attractive addition to a portfolio whose principal objective is wealth accumulation by active investing. We daily evaluate future near-term price gain prospects for quality, market-seasoned ETFs, based on the expectations of market-makers [MMs], drawing on their insights from client order-flows. The analysis of our subject ETFs’ price prospects is reinforced by parallel MM forecasts for each of the ETF’s ten largest holdings. Qualitative appraisals of the forecasts are derived from how well the MMs have foreseen subsequent price behaviors following prior forecasts similar to today’s. Size of prospective gains, odds of winning transactions, worst-case price drawdowns, and marketability measures are all taken into account. Today’s most attractive ETF Today’s most attractive ETF is the SPDR S&P Retail ETF (NYSEARCA: XRT ). The investment seeks to provide investment results that, before fees and expenses, correspond generally to the total return performance of an index derived from the retail segment of a U.S. total market composite index. In seeking to track the performance of the S&P Retail Select Industry Index (the “index”), the fund employs a sampling strategy. It generally invests substantially all, but at least 80%, of its total assets in the securities comprising the index. The index represents the retail industry group of the S&P Total Market Index (“S&P TMI”). The fund is non-diversified (Description from Yahoo Finance) Figure 1 (used with permission) The vertical lines of Figure 1 are a visual history of forward-looking expectations of coming prices for the subject ETF. They are not a backward-in-time look at actual daily price ranges, but the heavy dot in each range is the ending market quote of the day the forecast was made. What is important in the picture is the balance of upside prospects in comparison to downside concerns. That ratio is expressed in the Range Index [RI], whose number tells what percentage of the whole range lies below the then current price. Today’s Range Index is used to evaluate how well prior forecasts of similar RIs for this ETF have previously worked out. The size of that historic sample is given near the right-hand end of the data line below the picture. The current RI’s size in relation to all available RIs of the past 5 years is indicated in the small blue thumbnail distribution at the bottom of Figure 1. The first items in the data line are current information: The current high and low of the forecast range, and the percent change from the market quote to the top of the range, as a sell target. The Range Index is of the current forecast. Other items of data are all derived from the history of prior forecasts. They stem from applying a T ime- E fficient R isk M anagement D iscipline to hypothetical holdings initiated by the MM forecasts. That discipline requires a next-day closing price cost position be held no longer than 63 market days (3 months) unless first encountered by a market close equal to or above the sell target. The net payoffs are the cumulative average simple percent gains of all such forecast positions, including losses. Days held are average market rather than calendar days held in the sample positions. Drawdown exposure indicates the typical worst-case price experience during those holding periods. Win odds tells what percentage proportion of the sample recovered from the drawdowns to produce a gain. The cred(ibility) ratio compares the sell target prospect with the historic net payoff experiences. Figure 2 provides a longer-time perspective by drawing a once-a week look from the Figure 1 source forecasts, back over two years. Figure 2 (used with permission) What does this ETF hold, causing such price expectations? Figure 3 is a table of securities held by the subject ETF, indicating its concentration in the top ten largest holdings, and their percentage of the ETF’s total value. Figure 3 source: Yahoo Finance XRT apparently takes a low-concentration approach to holdings, with an average of 1¼% of its assets in each of its top ten commitments. This provides a wide dispersion of holdings among competitive investment contestants in an industry where success rewards can be huge, while failures may be complete. If the remaining 88% of assets are distributed on a comparable basis 99 separate bets may be being made, offering great diversification, as well as dilution of encountered bonanzas. Where ultimate payoffs are less dependent on initial capital commitment size, this may be an advantaged strategy. Figure 4 is a table of data lines similar to that contained in Figure 1, for each of the top ten holdings of XRT. Figure 4 (click to enlarge) In an industry as unpredictably dynamic as this, wide variations in market experience seem to be the rule. Column (5) contains the upside price change forecasts between current market prices and the upper limit of prices regarded by MMs as being worth paying for price change protection. The average of +10.2% of the top ten XRT holdings is near the population average of all 2600+ equities MM forecasts of +13.4%. It is about double the upside forecast for SPY price change prospects. The other side of the coin is column (6), which shows what actual worst-case price drawdowns have been typical in the 3 months following each time there has been a forecast like those of the present day. Those risk exposures have been about -7% in the holdings top ten, less than -9 by equities at large, and only -3.2% on the SPY ETF. But these holdings are attractive reward tradeoffs between returns and risks, with the top ten (column 14) at a ratio of 1.4, compared to equities overall at 1.6 times. The market average of SPY provides a ratio of 1.6 times risk avoidance. Another qualitative consideration is the credibility of the ten XRT big holdings after previous forecasts like today’s. The net average price change (column 13) of the ten has been only 0.5 times the size of the upside forecast average, +4.8% compared to +10.2%. The equity population’s actual price gain achievement, net of losses has been a pitiful +3.3% compared to promises of 13.4%. The ability of XRT holdings to recover from those worst-case drawdowns and achieve profits occurred in 75% of experiences. The equity population only recovered less than two thirds of the time, and while the SPY experiences were more consistent like the ten XRT holdings, the achieved gains were much smaller. SPY has had only +3.2% gains previously from like forecasts of +5.2%. The 20 top prospective equities from our overall equity population have superior credentials historically, given the past performance of present MM price range outlooks. Their reward-risk score of 1.8 is the highest of the four blue row averages. Their price recovery ability at 89% contributes mightily to their upside price forecast credibility and their % payoff achievement. Moving to targets more quickly than others has generated annual rates of gain (11) three times the XRT holdings and five times the rate of the population and market average. Conclusion XRT provides competitive forecast price gains in comparison to many other sector ETFs, supported by the outlooks for their largest holdings. Both the ETF and many of its major holdings offer strong prospects in near-term price behaviors, demonstrated by previous experiences following prior similar forecasts by market makers. In a market environment many consider to be at risk they present a reasonable defensive alternative. Disclosure: I/we have no positions in any stocks mentioned, and no plans to initiate any positions within the next 72 hours. (More…) I wrote this article myself, and it expresses my own opinions. I am not receiving compensation for it (other than from Seeking Alpha). I have no business relationship with any company whose stock is mentioned in this article.