Tag Archives: denmark

ETF Strategies To Gain From In The Rest Of 2016

After a lackluster patch, the broader market showed some strength in Q2, but occasional volatility is still showing up. The S&P 500 is striving to stay in the green from the year-to-date look (as of May 18, 2016) (read: S&P 500 Again Shows Weakness: Go Short with These ETFs ). Several marked changes were noticed during this time, including the solid comeback in oil prices and subtle stabilization in the Chinese economy. But it seems that the S&P 500 is far from seeing its past success in the rest of this year. Though the U.S. economy started taking root lately and is expected to see upbeat growth in Q2, volatility will likely rule the market. Imminent ‘Brexit’ vote, further Fed rate hikes and the U.S. election in November will definitely not let the market stay calm (read: British ETFs in Focus on Brexit Talks ). Investors should note that though the Fed hike symbolizes a steady U.S. economy, the imminent reaction is a crash in the stock market in fear of a dearth in cheap money inflows. Against this backdrop, investors may want to know some worthwhile investing strategies. For them we highlight the trending policies in the market and some profitable ETF bets. Analysts Muted on Stocks Bank of America believes that the S&P 500 could slip to its February lows, while Morgan Stanley has applied the famous maxim “Sell in May and go away” to stocks at least till November. Goldman Sachs has also cut its outlook on equities to “neutral” over the coming one year. Now Goldman has gone “neutral” on U.S. (upgraded), Europe (downgraded), Japan (downgraded) and Asia ex-Japan equities. Europe and Japan definitely bear the burden of stronger currencies and weaker financial sectors due to the ongoing negative interest rates. On the other hand, U.S. equities may suffer from choppy earnings, overvaluation concerns and the Fed move. The ripple effects of any crash in the S&P 500 may shake stocks worldwide. So, it’s better to bet on the ProShares Short S&P 500 ETF (NYSEARCA: SH ) , the ProShares Short MSCI Emerging Markets ETF (NYSEARCA: EUM ) , or the ProShares Short MSCI EAFE ETF (NYSEARCA: EFZ ) . Time for Money Market Instruments? As per Goldman, cash can be an overweight pick this year due to fewer chances of a Fed rate hike. In such a situation, investors can bet on cash-like money market ETFs like the Guggenheim Enhanced Short Duration Bond ETF (NYSEARCA: GSY ) and the SPDR Barclays 1-3 Month T-Bill ETF (NYSEARCA: BIL ) . One thing is for sure, a rate hike will hit both stocks and bonds. This is because as the Fed enacts, yields will jump pushing bond prices down. Even Goldman is worrying about the interest rate shock. Investment Grade Corporate Bonds: Safety + Yield Investors can also consider long-term corporate bond ETFs like the Vanguard Long-Term Corporate Bond Index ETF (NASDAQ: VCLT ) for higher yields than treasuries. Goldman Sachs now expects its year-end 10-year yield to be 2.4%, down from the 2.75% it had projected in the first quarter. Bank of America Merrill Lynch pared down its forecast for the yearend 10-year yield to 2% from 2.65% at the start of the year. Morgan Stanley projects a lower 10-year yield at 1.75%, down from 2.7% when the year had started. So, the drive for higher yield is expected in the marketplace. However, since corporate bonds are riskier in nature, honing in on investment-grade ones is a prerequisite. After all, corporate leverage is peaking, so investors need to be aware of default risks. VCLT yields 4.30% annually (as of May 18, 2016). Play Rebound in Oil; but Tread Cautiously Oil prices have seen a lot in last two years. Now that things are turning in favor for oil with shrinking supply glut and a possible recovery in demand, a play on oil is warranted. With oil, investors can also bet on high-yield bond ETFs like the AdvisorShares Peritus High Yield ETF (NYSEARCA: HYLD ) . This is because of the fact that the U.S. energy companies are closely tied to the high-yield bond market, with the former comprising a considerable amount of junk bond issuance. Volatility to Crack the Whip: Play Risk Aware Volatility is expected to be strong in 2016. Investors can deal with this in various ways. While low volatility ETFs like the PowerShares S&P 500 Low Volatility Portfolio ETF (NYSEARCA: SPLV ) can be an option, defensive ETFs like the QuantShares U.S. Market Neutral Anti-Beta ETF (NYSEARCA: BTAL ) and risk-aware ETFs like the SPDR SSgA Risk Aware ETF (NYSEARCA: RORO ) can be tapped too. And last but not the least in queue are volatility ETFs themselves such as the C-Tracks on Citi Volatility Index ETN (NYSEARCA: CVOL ) and the ProShares VIX Short-Term Futures ETF (NYSEARCA: VIXY ) . Notably, as the name suggests, volatility products are quite rowdy in nature and thus suit investors with a short-term notion. Gold to Hit $1,400? Steep Fed tightening or not, the gold market looks shiny thanks to global political risks this year. Along with many other optimistic analysts, Denmark’s Saxo Bank A/S turned bullish on gold and projected that the price may hit as high as $1,400 this year. This invariably puts gold ETFs like the SPDR Gold Trust ETF (NYSEARCA: GLD ) in focus. Link to the original post on Zacks.com
Hungary Too In The Rate-Cut Club: ETFs In Focus

Hungary slashed its benchmark three-month deposit rate to a new low of 1.20% from 1.35%. It also lowered the overnight lending rate to 1.45% from 2.1%. The overnight deposit rate is now in negative territory from 0.1%.to -0.05%. The central bank took the step citing low imported inflation, European Central Bank (ECB) easing measures and continued slump in oil prices. Meanwhile, the bank also lowered its forecast for inflation this year. The bank now expects inflation to be around 0.3% as compared to the previous expectation of 1.7% announced in December. The target inflation the bank seeks to achieve is 3%. Thus, it plans to set a benchmark rate at such levels, which can be maintained for an extended period to reach its inflation target. Earlier this month, the ECB came up with a more intensified economic stimulus and opted for multiple rate cuts and the expansion of its quantitative easing program to boost the economy. Meanwhile, several other countries are undertaking easing measures and cutting rates. Last week, Norway indicated that it could join other European countries Sweden, Denmark and Switzerland in sub-zero levels of interest rate. On the other side of the pond, the Fed kept a dovish stance and dialed back its number of rate hikes to two instead of four as was projected last December. The rate cut measures by the Hungarian central bank, which was undertaking initiatives like cheap lending to small firms, subsidized funds to retail banks and buying government bonds, represent a huge shift in policy. Although the possibility of further rate cuts can’t be excluded, the central bank warned that too low rates may be counterproductive, forcing the banks to tighten lending conditions. Keeping these points in mind, we highlight four ETFs – RevenueShares Global Growth ETF (NYSEARCA: RGRO ), Cambria Global Value ETF (NYSEARCA: GVAL ), Guggenheim MSCI Emerging Markets Equal Weight ETF (NYSEARCA: EWEM ) and EGShares Low Volatility Emerging Markets Dividend ETF (NYSEARCA: HILO ) – that have high exposure of 11.7%, 7.7%, 5% and 4.8%, respectively, to Hungary. RGRO This ETF looks to track the RevenueShares Global Growth Index comprising the top five developed and top five emerging countries in the Standard & Poor’s Global Broad Market Index based on year-over-year GDP growth from the prior two quarters. The fund charges 70 basis points a year and has 95 stocks in its basket. Energy takes 21% of the fund’s exposure followed by basic materials and financials. As much as 74% stocks in the fund are large caps. The fund has total assets of $2.1 million with paltry volumes of less than 1,000 shares. It has gained 6% so far this year (as of March 23, 2016). GVAL GVAL seeks to match the performance of the Cambria Global Value Index. With 126 stocks in its basket, the fund is well diversified with none of the stocks holding more than 3% weight while financials has the highest exposure at 23%. With total assets of $65.7 million, the fund has average volume of 17,000 shares and an expense ratio of 69 basis points. It has returned 3.3% so far this year. EWEM EWEM is based on the MSCI Emerging Markets Equal Country Weighted Index and has 346 stocks in its basket with none holding more than 4% of total assets. The fund has an AUM of $11 million and trades in average volumes of 5,000. Financials dominates in terms of sector exposure, accounting for an almost 39% of total assets. The fund charges an expense ratio of 76 basis points. It has gained 7.1% in the year-to-date period. HILO HILO is based on the EGAI Emerging Markets Quality Dividend Index and has 49 stocks in its basket with none holding more than 2.3% of total assets. The fund has an AUM of $17.3 million and trades in average volumes of 6,000. Financials dominates in terms of sector exposure with telecommunication services and materials rounding off the top three. The fund charges an expense ratio of 85 basis points. It is up 9.8% in the year-to-date period. Original post

Long-Term Underperformance Of European Active Management Continues To Play Out In The Active Vs. Passive Debate

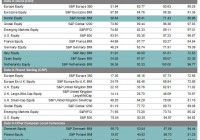
By Daniel Ung Every six months, S&P Dow Jones Indices publishes the S&P Indices Versus Active (SPIVA®) Europe Scorecard, which seeks to compare the performance of actively managed equity funds across different categories, and in the SPIVA Europe Year-End 2015 Scorecard , we expanded it to cover more individual countries and regions. Among the new additions are Italy, the Netherlands, Poland, Spain, Switzerland, and the Nordic region, with specific data for Denmark and Sweden. This is also the first year-end report in which 10-year data is published for Europe. To access the full report, please click here and for the video summarizing the major findings of the report, please click here . Global equity markets, as measured by the S&P Global 1200 , rose 10.4% over the past one-year period, as measured in euros, which could largely be attributed to the European Central Bank’s quantitative easing program. However, this apparently positive performance masked the heightened volatility that the equity markets experienced over the course of the year, which was a consequence of anemic Chinese growth, as well as the collapse in energy and commodity prices. Compared to the S&P Europe 350 , while 68.1% of active managers outperformed the benchmark over the short run, they underperformed the benchmark over longer time horizons. 63.8% of active managers underperformed the benchmark by the end of the three-year period, 80.6% in the five-year period, and 86.3% over the 10-year period. Exhibit 1 shows the new categories highlighted in blue. As for the global, emerging market, and U.S. equity categories, actively managed funds – in both euro and pound sterling – underperformed substantially in the short term (one-year category) and in the long run (10-year category). For instance, 61.2% of global equity funds underperformed their benchmark over a one-year period, and 89.08% of funds underperformed the benchmark over a 10-year period. Disclosure: © S&P Dow Jones Indices LLC 2015. Indexology® is a trademark of S&P Dow Jones Indices LLC (SPDJI). S&P® is a trademark of Standard & Poor’s Financial Services LLC and Dow Jones® is a trademark of Dow Jones Trademark Holdings LLC, and those marks have been licensed to S&P DJI. This material is reproduced with the prior written consent of S&P DJI. For more information on S&P DJI and to see our full disclaimer, visit www.spdji.com/terms-of-use .