Tag Archives: load

Preliminary Fed Report Says Don’t Fear Leveraged ETFs

By Mark Melin Leveraged and inverse ETFs, which have come under heavy criticism as potentially exacerbating volatility in financial markets, are not the danger that critics have made them out to be, concludes a preliminary study from U.S. Federal Reserve researchers. In their white paper, ” Are Concerns About Leveraged ETFs Overblown ,” Fed researchers Ivan T. Ivanov and Stephen L. Lenkey make the case that concerns in this regard are exaggerated. To the contrary, the authors assert that “capital flows considerably reduce ETF rebalancing demand and, therefore, mitigate the potential for ETFs to amplify volatility.” (click to enlarge) Opposition to the leveraged ETFs Initial opposition to the leveraged ETFs was strong. In fact, as The Wall Street Journal’s Pedro Nicolaci Da Costa notes, both the Securities and Exchange Commission and the Fed had issued warnings regarding leveraged ETFs. In fact, at one point the SEC had issued a moratorium on approving exemption requests for new leveraged and inverse ETFs, typically a serious sign of trouble from regulators. The primary point of concern focused on what the report said was a common “perception” that the process of re-balancing leveraged and inverse ETF portfolios exacerbated performance. If the ETF was experiencing positive returns, the conventional thinking was leveraged ETFs distorted prices higher. More concerning to market observers was the notion that if the ETF experienced negative price movement, leverage would then amplify market moves lower in price. It is at this point that researchers Lenkey and Ivanov disagree. “Such reasoning is incomplete because it overlooks the effects of capital flows,” they note in their white paper, characterizing concerns regarding these products are “likely exaggerated.” (click to enlarge) Leveraged ETFs capital diminishes the potential to exacerbate volatility The paper asserts that capital coming in and out of a leveraged ETF diminishes the potential to exacerbate volatility. This is because capital flows occur frequently and tend to offset the need for ETFs to rebalance their portfolios. A key conclusion is that ETF rebalancing demand is strongest when returns are large in magnitude, which is important because ETFs would presumably be most prone to amplify market movements in these cases. The report, however, relies on the stock market recovery to offset negative asset from a market crash. “The large decline in the value of the S&P 500 during 2008-09 leads to a large capital inflow. This results in more assets under management for the ETF relative to the benchmark case with no capital flows. Then, as the index recovers, the ETF undergoes a greater amount of rebalancing on a day-to-day basis because it has more assets under management.” Several market watchers, including hedge fund manager Carl Icahn, have raised concerns that the next market crash could involve derivatives more destructive than the 2008 crash, leading to a more difficult recovery, a recovery model that the authors did not model. Read the full report here . Disclosure: None

SCHX: It’s Like SPY With Lower Expense Ratios

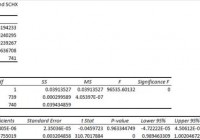
Summary I’m taking a look at SCHX as a candidate for inclusion in my ETF portfolio. SCHX looks incredible in my initial review. The ETF has slightly better diversification than SPY, but similar overall risk. I expect SCHX to be a core part of my new portfolio. I’m not assessing any tax impacts. Investors should check their own situation for tax exposure. Investors should be seeking to improve their risk-adjusted returns. I’m a big fan of using ETFs to achieve the risk adjusted returns relative to the portfolios that a normal investor can generate for themselves after trading costs. I’m working on building a new portfolio and I’m going to be analyzing several of the ETFs that I am considering for my personal portfolio. One of the funds that I’m considering is the Schwab U.S. Large-Cap ETF (NYSEARCA: SCHX ). I’ll be performing a substantial portion of my analysis along the lines of modern portfolio theory, so my goal is to find ways to minimize costs while achieving diversification to reduce my risk level. What does SCHX do? SCHX attempts to track the total return of the Dow Jones U.S. Large-Cap Total Stock Market Index. At least 90% of funds are invested in companies that are part of the index. SCHX falls under the category of “Large Blend”. Does SCHX provide diversification benefits to a portfolio? Each investor may hold a different portfolio, but I use (NYSEARCA: SPY ) as the basis for my analysis. I believe SPY, or another large cap U.S. fund with similar properties, represents the reasonable first step for many investors designing an ETF portfolio. Therefore, I start my diversification analysis by seeing how it works with SPY. I start with an ANOVA table: (click to enlarge) The correlation is over 99%. In short, no benefits should be expected from combining the ETF with SPY. That’s fine; the holdings are largely the same as SPY. SCHX is a replacement ETF for SPY, not a complementary holding. Standard deviation of daily returns (dividend adjusted, measured since January 2012) The standard deviation is higher. For SCHX it is .7303%. For SPY, it is 0.7300% over the same period. SPY usually beats other ETFs in this regard, and the difference between the two is largely meaningless. Because the two funds have extremely high correlation and almost identical risk profiles, the most important part of the comparison will probably be the expense ratios. Allocation I believe a fund like SPY or SCHX should be a core holding in most portfolios. Therefore, I think a reasonable level of exposure ranges from 10% to 35%. The largest exposure I would want to consider would be around 50%. In my opinion, by the time exposure levels get that high, there are other investments that can be mixed in to lower the total risk of the portfolio without hurting the expected returns. Why I use standard deviation of daily returns I don’t believe historical returns have predictive power for future returns, but I do believe historical values for standard deviations of returns relative to other ETFs have some predictive power on future risks and correlations. Under standard deviation of daily returns, the S&P 500 is remarkably efficient in long-term growth relative to volatility. Yield & Taxes The distribution yield is 1.70%. The SEC yield is 1.78%. Based on the yields, I think the ETF is solid as a part of a portfolio for retirees. If I were retiring, I would want to lower my position in SPY or SCHX in favor of putting more of the portfolio into slightly higher yielding value companies. However, I still think an exposure around 10% would be both reasonable and prudent in many scenarios. It’s difficult to build a portfolio near the efficient frontier, in my opinion, without including an ETF that tracks large U.S. companies. Because I have a long ways to go to reach retirement, I want an exposure in the 15 to 30% range. I’m not a CPA or CFP, so I’m not assessing any tax impacts. Expense Ratio The ETF is posting .04% for an expense ratio. I want diversification, I want stability, and I don’t want to pay for them. The .04% expense ratio makes me happy as an investor. SPY appears to have around .09% for an expense ratio. The ratio for SPY is actually closer to .094%, but it is regularly rounded down when screening. Market to NAV The ETF is at a .06% premium to NAV currently. It is trading pretty close to NAV, but in the interest of risk-adjusted returns I really like to know that I’m buying it right on or just below NAV. Premiums or discounts to NAV can change very quickly so investors should check prior to putting in an order. Largest Holdings The portfolio has solid diversification. SPY is holding a very similar portfolio but with a slightly larger allocation to the top companies, such as 3.55% in Apple (NASDAQ: AAPL ). However, the additional diversification for SCHX can be partially set off by some of the companies near the top being less volatile or by the ETF having less trading volume. (click to enlarge) Conclusion I’m currently screening a large volume of ETFs for my own portfolio. The portfolio I’m building is through Schwab, so I’m able to trade SCHX with no commissions. I have a strong preference for researching ETFs that are free to trade in my account, so most of my research will be on ETFs that fall under the “ETF OneSource” program. SCHX is a very strong contender to be a core holding in the new portfolio. I wanted a replacement for SPY that I would be able to trade without commissions. Of course, I also wanted to see a lower expense ratio, and SCHX delivered that. When I transfer money into this new portfolio (probably in February), I expect that SCHX will be allocated 15 to 30% of my portfolio value. I am not compensated by Schwab in any way for writing about ETFs that fall under their program. I select several ETFs under their program because I am doing research for my own investing and want to avoid trading fees. Additional disclosure: Information in this article represents the opinion of the analyst. All statements are represented as opinions, rather than facts, and should not be construed as advice to buy or sell a security. Ratings of “outperform” and “underperform” reflect the analyst’s estimation of a divergence between the market value for a security and the price that would be appropriate given the potential for risks and returns relative to other securities. The analyst does not know your particular objectives for returns or constraints upon investing. All investors are encouraged to do their own research before making any investment decision. Information is regularly obtained from Yahoo Finance, Google Finance, and SEC Database. If Yahoo, Google, or the SEC database contained faulty or old information it could be incorporated into my analysis. The analyst holds a diversified portfolio including mutual funds or index funds which may include a small long exposure to the stock.

SPDR S&P MidCap 400 ETF: MDY’s 2014 And Fourth-Quarter Performance And Seasonality

Summary The SPDR S&P MidCap 400 ETF ranked No. 2 in 2014 among the three most popular exchange traded funds based on the S&P 1500’s constituent indexes. Most recently, the ETF’s adjusted closing daily share price last month expanded to $263.97 from $261.79, an increase of $2.18, or 0.83 percent. Seasonality analysis shows the fund’s price accelerates in the fourth quarter of an average year, but decelerated in Q4 of last year. The SPDR S&P MidCap 400 Trust ETF (NYSEARCA: MDY ) ranked second by return during 2014 among the three most popular ETFs based on the S&P 1500’s constituent indexes, as it behaved worse than the SPDR S&P 500 Trust ETF (NYSEARCA: SPY ) and better than the iShares Core S&P Small-Cap ETF (NYSEARCA: IJR ). Measured by adjusted closing daily share prices, MDY climbed to $263.97 from $241.29, a hike of $22.68, or 9.40 percent. Accordingly, the middle-capitalization ETF underperformed the large-cap SPY by -4.06 percentage points and overperformed the small-cap IJR by 3.55 percentage points. Both seasonality and U.S Federal Reserve policy appear likely to be headwinds for MDY over the coming quarter. The Fed announced the end of asset purchases under its third formal quantitative easing program on October 29, 2014, and may announce the beginning of its next round of federal funds rate increases on April 29, 2015. The Fed’s conclusion of purchases under its first two formal QE programs this century is associated with bear markets in MDY , with the ETF slipping -21.16 percent in 2010 and -28.13 percent in 2011. Figure 1: MDY Monthly Change, 2014 Vs. 1996-2013 Mean (click to enlarge) Source: This J.J.’s Risky Business chart is based on analyses of adjusted closing monthly share prices at Yahoo Finance . MDY behaved a little worse in 2014 than it did during its initial 18 full years of existence, based on the monthly means calculated by employing data associated with that historical time frame (Figure 1). The same data set shows the average year’s weakest quarter was the third, with a relatively small negative return, and its strongest quarter was the fourth, with an absolutely large positive return. The ETF ran true to form overall in Q4 last year, but its share price decelerated rather than accelerated into 2015. Figure 2: MDY Monthly Change, 2014 Vs. 1996-2013 Median (click to enlarge) Source: This J.J.’s Risky Business chart is based on analyses of adjusted closing monthly share prices at Yahoo Finance. MDY performed much worse in 2014 than it did over its initial 18 full years of existence, based on the monthly medians calculated by using data associated with that historical time frame (Figure 2). The same data set shows the average year’s weakest quarter was the third, with a relatively small negative return, and its strongest quarter was the fourth, with an absolutely large positive return. Meanwhile, the latest figure generated by my proprietary U.S. Economic Index methodology and other multivariate analyses continue to indicate the metric may have hit either a long- or a short-term high level in August. As a result, I suspect American economic performance could soon join seasonality and Fed policy as a headwind for the equity market in general and for MDY in particular. Disclaimer: The opinions expressed herein by the author do not constitute an investment recommendation, and they are unsuitable for employment in the making of investment decisions. The opinions expressed herein address only certain aspects of potential investment in any securities and cannot substitute for comprehensive investment analysis. The opinions expressed herein are based on an incomplete set of information, illustrative in nature, and limited in scope. In addition, the opinions expressed herein reflect the author’s best judgment as of the date of publication, and they are subject to change without notice.