Tag Archives: load

The Swiss Remind Us Why You Should Always Own Some Gold

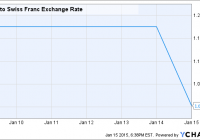
Swiss Franc moves throw a wrech in the global currency picture on Thursday. Gold rallies on the news. We think that some capital should always be allocated to gold. By Thom Lachenmann The overnight news about Switzerland left the markets in a frenzy this morning and were no doubt beacons of both fantastic and horrifying news for FX traders who missed the trade and woke up to mayhem. Switzerland’s central bank stopped pegging the franc to the euro, a move that we really can’t blame them for. In trying to “defend” the Swiss franc, the Swiss national bank had ran up quite a bill. So, they let the dam burst, and burst it did. It was a rule put in place in order to keep the currency from getting too strong, a concept that we find ridiculous to begin with. Currencies, of course, get stronger and weaker based on the overall health of the nation’s macro economy. Limiting the strength of your currency is a dopey thing to do, unless you’re an equity market trader with a full scale bullish position. Switzerland’s tactic of lowering interest rates on the franc while doing this didn’t seem to help at all and the franc skyrocketed to all time highs today. Euro to Swiss Franc Exchange Rate data by YCharts Of course, with the whole world expecting Europe to implement some type of economic stimulus, the Swiss Central Bank could have had a real quagmire on its hands trying to defend its currency if there was a flee from the euro. When countries stimulate the way the ECB could potentially do, it generally causes the currency to devalue in a sharp fashion. We were reminded of the benefits of having some gold in your portfolio today, as well. The commodity was up nearly 2% on Thursday after the Swiss news hit the wires. We think there’s a couple reasons that gold got the boost. First, obviously, people that are having “flights to safety,” as Reuters called it, are simply getting into the precious metal as a portfolio hedge or as a safe haven for capital. Secondly, we believe that the notion of Switzerland unpinning their currency from a major national bank reminds people about the true value of gold, when looked at as a non-recurring resource. Gold is held in reserves by these types of central banks for these reasons, and today’s move by the Swiss shows that not ALL countries have drifted into the “Keynesian Dream” that the US, China, and ECB are in. Swiss equities were crushed, down 11% when U.S. markets opened on Thursday morning. When countries take the “unpopular” but safe moves of thinking Austrian, gold flourishes. This type of move is a nice subtle reminder to note when we’re always going to think of gold as a great safe haven for investors and something that a well balanced investor should always allocate some portion of their capital too, whether it’s through funds or the physical commodity.

Investors Still Betting On Oil ETFs

Summary Russian ETF inflows continued to add exposure to the country in 2014, but first signs of outflows in 2015. Oil ETFs have seen net inflows of $1.3bn so far this year. Investors have pulled $80bn from gold ETFs since 2012. Collapsing oil prices and the free falling Russian market have so far not tested the patience of ETF investors, who continued to double down on these loss-making trades in 2014; a stark contrast to 2013’s gold slump when ETF investors rushed to the door. ETF investors’ Russian affair Russian exposed ETFs saw consistent inflows of $1.5bn in the last five months of 2014 as the Russian market continued to decline with sanctions, declining oil prices and the devaluing rouble hitting the market. However, while these inflows were occurring, the largest Russian exposed ETF, the Market Vectors Russian ETF (NYSEARCA: RSX ), saw its price decrease by over a third from August to December 2014. This trend looks to be reversing somewhat in the New Year, as Russian exposed ETFs are on track for their first monthly outflows in six months, as investors’ resilience and staying power may have begun to wane. Chasing oil’s bottom Oil prices have slid by 50% since mid-June 2014 and the largest Oil ETF, the United States Oil Fund (NYSEARCA: USO ) with AUM of $1.7bn, is down by a parallel 54% over the same time period. ETF investors are continuing to ‘double down’ after catching knives over the past four months while oil prices continued to decline. Prices are currently hovering at $46 per barrel (Brent). Investors’ faith in an oil price recovery seems to have increased, as fund flows into oil exposed ETFs look set to beat December’s total inflows of $1.7bn, with inflows so far this month already standing at $1.3bn. Interestingly, oil was at similar price level back in 2009, when we also saw strong inflows into oil ETFs after a dramatic collapse in global oil prices. ETF investors could see more red in the short term though, as news out this week reveals record oil imports for China hitting highs of 7m barrels per day. These have been cited as being destined for strategic and commercial reserves. Turning against gold Gold has not been so precious in the eyes of ETF investors, as ETFs exposed to the metal’s price movements have continued to see sustained outflows over the last two years. The last two years has seen only four months of net inflows. This comes as the commodity declined from 2011 highs of ~$1800, stabilising at $1259 currently. The end of quantitative easing in the US and an expectation of a strengthening dollar and weaker global demand has seen the precious metal fall out of favour with investors. The largest gold ETF, the SPDR Gold shares ETF (NYSEARCA: GLD ) has $28bn AUM which represents 44% of total AUM exposed to the metal. This AUM figure has fallen by over 60% from the $72bn it managed at start of January 2013.

Consumer Discretionary ETF: XLY No. 7 Select Sector SPDR In 2014

Summary The Consumer Discretionary exchange-traded fund finished seventh by return among the nine Select Sector SPDRs in 2014. The ETF was relatively weak in the first and third quarters, absolutely strong in the second and fourth quarters. Seasonality analysis of Q1 is a mixed bag, but my data interpretation points to a middle-of-the-pack performance. The Consumer Discretionary Select Sector SPDR ETF (NYSEARCA: XLY ) in 2014 ranked No. 7 by return among the Select Sector SPDRs that partition the S&P 500 into nine pieces. On an adjusted closing daily share-price basis, XLY advanced to $72.15 from $65.91, a gain of $6.24, or 9.47 percent. Thus, it behaved worse than its sibling, the Utilities Select Sector SPDR ETF (NYSEARCA: XLU ) and parent proxy, the SPDR S&P 500 Trust ETF (NYSEARCA: SPY ) by -19.27 and -4.00 percentage points, respectively. (XLY closed at $70.51 Tuesday.) XLY ranked No. 2 among the sector SPDRs in the fourth quarter, when it led SPY by 3.74 percentage points and lagged XLU by -4.54 points. And XLY ranked No. 3 among the sector SPDRs in December, when it performed better than SPY by 1.15 percentage points and worse than XLU by -2.68 points. Figure 1: XLY Monthly Change, 2014 Vs. 1999-2013 Mean (click to enlarge) Source: This J.J.’s Risky Business chart is based on analyses of adjusted closing monthly share prices at Yahoo Finance . XLY behaved about the same in 2014 as it did during its initial 15 full years of existence based on the monthly means calculated by employing data associated with that historical time frame (Figure 1). The same data set shows the average year’s weakest quarter was the third, with an absolutely large negative return, and its strongest quarter was the fourth, with an absolutely larger positive return. Generally consistent with this pattern last year, the ETF had a very small gain in Q3 and a very large gain in Q4. Figure 2: XLY Monthly Change, 2014 Versus 1999-2013 Median (click to enlarge) Source: This J.J.’s Risky Business chart is based on analyses of adjusted closing monthly share prices at Yahoo Finance. XLY performed worse in 2014 than it did during its initial 15 full years of existence based on the monthly medians calculated by using data associated with that historical time frame (Figure 2). The same data set shows the average year’s weakest quarter was the third, with a relatively large negative return, and its strongest quarter was the fourth, with an absolutely large positive return. It also shows there is no historical statistical tendency for the ETF to explode in Q1. Figure 3: XLY’s Top 10 Holdings and P/E-G Ratios, Jan. 13 (click to enlarge) Note: The XLY holding-weight-by-percentage scale is on the left (green), and the company price/earnings-to-growth ratio scale is on the right (red). Source: This J.J.’s Risky Business chart is based on data at the XLY microsite and Yahoo Finance (both current as of Jan. 13). To me, many of XLY’s component companies appear mispriced, either by a little or by a lot (Figure 3). I discussed one of them in “Amazon.com: The Most Overvalued Profitable Company In The S&P 500, Still” a while ago. Since then, Amazon (NASDAQ: AMZN ) has slipped back to unprofitability from profitability, but it remains overvalued. However, the facts on the S&P 500 consumer-discretionary sector reported by S&P Senior Index Analyst Howard Silverblatt Dec. 31 seem to be at variance with my opinions about it: He calculated its P/E-G ratio as 1.15, the lowest level of any of the index’s 10 sectors. Harrumph. The valuation issue aside, XLY’s prospects may be brighter now than they were six months ago: Among the Select Sector SPDRs, the ETF might be the biggest beneficiary of the collapse in the crude-oil commodity market, where the CME Group front-month futures price per barrel fell to $45.89 Tuesday from $107.26 June 20, a tumble of $61.37, or 57.22 percent, according to the U.S. Energy Information Administration . (The contract settled at $48.48 Wednesday, the CME Group reported.) Therefore, I would be completely unsurprised should XLY be a middle-of-the-pack performer among the sector SPDRs this quarter. Disclaimer: The opinions expressed herein by the author do not constitute an investment recommendation, and they are unsuitable for employment in the making of investment decisions. The opinions expressed herein address only certain aspects of potential investment in any securities and cannot substitute for comprehensive investment analysis. The opinions expressed herein are based on an incomplete set of information, illustrative in nature, and limited in scope. In addition, the opinions expressed herein reflect the author’s best judgment as of the date of publication, and they are subject to change without notice.