Tag Archives: load

Where To Invest In 2015 In Asian Emerging Markets

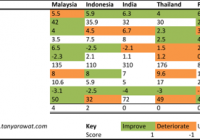
We are at crossroads of diverging monetary policies. GRI’s analyst Tanya Rawat breaks down what this means for investment in emerging markets (EM) in Asia. The U.S. gets ready to tighten policy rates whereas the Eurozone and Japan have adopted easing measures to invigorate economies at a risk of falling into a disinflationary cycle if not deflationary. Taking account of this paradigm shift, the lure of high carry, which some of the high yielding Asian currencies offer will no longer suffice, especially if U.S. Treasury yields were to rise quickly as well. The differentiating factor then in choosing the right investment destination in emerging market (EM) Asia will be domestic stability, external fundamental factors viz. current account balances, FX reserves, percentage of short-term liabilities backed by these reserves, robustness of FX policy and the credibility of the central banks. We use a rather simple scorecard methodology to choose probable winner and losers: (click to enlarge) Korea is the only the country with a positive fiscal balance and as a function of it, the lowest gross public sector debt. Add to this the layer of currency sensitivity to rising US interest rates, in 2014, the Korean Won performed the best with high core balance (current account balance + net FDI, both as a % of GDP), low real interest rates, REER undervaluation when compared to historical levels, a low leverage economy, high fiscal balance (% GDP), low gross public sector debt (% GDP) i.e. less susceptible to inflation and lastly sufficient FX cover. However, it does remain receptive to competitiveness from a weaker Yen and China’s growth uncertainty (largest export partners are China and the U.S.). Taiwan has the highest current account surplus, large FX Reserves and the highest import cover in the EM Asia universe. This makes it extremely robust to external shocks and there still remains room for inflation to catch up with the rest of the countries. While Malaysia scores well, investors should be sceptical as external FX vulnerability (exposure to changes in US rates) remains its Achilles’ heel and the country is also highly leveraged (household debt 86% of GDP). The Central bank has been sluggish in raising interest rates to curb this activity; the first hike of 25 bps since 2011 took place in the latter of 2014. Malaysia is a net oil exporter and thus remains to benefit the least from lower oil prices. Indonesia with the lowest current account balances (% GDP), import cover and highest short-term external debt (% of FX reserves), also remains quite vulnerable to US rate hikes. Also, it is one of only two countries on the planet with twin deficits; the other being India. However, the fiscal balance looks set to improve as the government stands to save highly due to elimination of fuel subsidy supported by lower oil prices, which now renders the current price cheaper than the subsidized rates. While India is neutral due to low core balance, low import cover and short-term external debt cover, it is positive that falling oil renders an improving current account balance, government savings on energy subsidies and ‘Modinomics’ that ensures momentum in economic reforms. Currently, all three rating agencies have India on a ‘Stable’ rating. Apart from offering the highest carry, inflation is trending lower as commodity prices continue to fall (CPI has a high sensitivity to energy prices) and monetary policy remains robust and supportive. Also, the Indian Central bank is keen to shift to inflation targeting from 2016 onwards (4% with deviation +/-2%). Thus far it has been enhancing credibility, largely by following prudent FX policy – absorbing portfolio inflows when they are strong and selling dollars when sentiment weakens. Reforms in the food market, rising investment in agriculture and a boost to rural productivity are necessary steps in the flight against persistently high inflation in India. Philippines and Thailand both have one of the lowest FX reserves in the world and food constitutes a high percentage of their CPI. Additionally, they do not fare well compared to other regions due to rising leverage and/or fiscal deficit, high portfolio liabilities and weaker core balances. Finally, while China offers the highest GDP growth (y-o-y) and has the largest FX reserves, it has one of the lowest current account balances (% GDP). Although signs of a fundamental slowdown in the economy became evident last year, the market was still one of the best performers in the world. This disconnect is worrying as the rapid increase in momentum came close in the heels of the opening the Chinese market to international investors via Stock-Connect. Recently, stimulus ‘steps’ are a case in point that the government is aware of this slowdown and is taking appropriate steps to alleviate the same. Investors should be skeptical of the China story simply on the basis that this time the stock market is lagging economic indicators, which maybe seen acting as a precedent to a deeper fundamental problem. Spending by the government may turn China into only the third region in the EM Asia universe with a twin deficit. (click to enlarge) (click to enlarge) 1-year (2013-14) performance of Asian EM currencies. Spot returns were trivial, while yield chasing was the norm given the rather benign carry environment. On such a playing field, the Indian Rupee was the prime victor (1M NDF Implied Yields). (Source: Bloomberg) (click to enlarge) With lower oil prices, Thailand, Indonesia, Taiwan and India standing to be relative gainers with Malaysia standing to lose as it is the only net exporter. (click to enlarge) Sensitivity of headline CPI changes to changes in energy costs. (click to enlarge) Even if the pass-through to consumer inflation is muted (as corporations will prefer to remain sluggish in lowering oil prices to maintain profitability), governments will eventually save on subsidies.

Recent Sell: Target Corporation

There’s a time to buy and a time to sell. My reasons for selling seemed rational. Don’t rely on your emotions to make investment decisions. Having a pre-arranged selling plan can be helpful when a decision to sell needs to be made. As a dividend growth investor I look for and buy stocks that appear to be a good value and have a descent dividend growth. However, it doesn’t mean I will buy and hold any particular stock in perpetuity. There comes a time when a particular stock no longer lives up to my expectations and the decision to sell has to be made. This is what has happened in my case when it came to Target Corp. (NYSE: TGT ). I had owned TGT since October 2013 which was a few months before the big data breach. Originally, I had bought the stock in the mid $60s range. As the stock fell into the mid $50s I purchased some more. I ended up with the stock at a cost basis of $61.67. As you may know, the stock started sliding after the data breach was made public and it bottomed at $55 in early February 2014. The stock meandered between $55 and $62 for much of the rest of the year until November 2014. Then it gapped up and headed north to about $77.50. Since then it has backed off to the $75 range. This is the point at which I decided it was time to exit. In the life of any investor it is just as important to know when to buy as when to sell. Buying and then forgetting about a stock could cause you much pain and suffering in your portfolio. There are numerous examples that could be referenced. Remember Enron, World Com, General Motors (NYSE: GM ), Lehman Brothers, Kmart, and etc. Many who held on to these stocks were wiped out. As the song goes, “You have to know when to hold them and know when to fold them”. I will now try and delineate why I decided to sell. Hopefully, the exercise will help both of us to be better investors. Target has no economic moat. There is no doubt it is a well known brand and has been in business some 50 years. The company now boasts a network of over 1800 stores. However, there is serious competition from the likes of Wal-Mart (NYSE: WMT ), Kroger (NYSE: KR ), Costco (NASDAQ: COST ) and online vendors. It really doesn’t have any great advantage over any of its competitors. Target’s price for several reasons is a bit stretched. Morning Star puts the Fair Value price in the mid $60s. On the technical side the price is far away from both the 200 and 50 day simple moving averages. Target’s current P/E ratio is north of 30. And the question in my mind is whether earnings are going to be better near term or get worse. There is still the question of how much the exit from the Canadian market will impact Target’s earning later this year. Also, there is the question of organic growth near term. I don’t see any particular catalyst that will drive growth higher. The dividend yield is now 2.75%. For me this is not acceptable. I need yield greater than 3.5% to achieve my investment goals. The growth in the dividend has been good up to this point. Last year’s dividend was increased by almost 21%. The current payout ratio is about 80%. I don’t believe the dividend growth rate will continue at such a high level. Earnings will be a key to whether dividend growth can be sustained at such high levels. The unrealized gain was the straw that broke the camel’s back. Before I sold, I had roughly 6 years of accumulated dividends sitting in my unrealized gains. As the old say goes, “a bird in the hand is worth two in the bush”. Basically, the decision came down to this, sell Target before my gains evaporated and use the money to fund a position that will meet my investment goals. It the moment I am looking a Tupperware Brands Corp.(NYSE: TUP ), StoneMor Partners (NYSE: STON ), Royal Dutch Shell (NYSE: RDS.B ), or Alliance Resource Partners (NASDAQ: ARLP ). Of course, it is not for me to say what you should do with Target. Each of us has our own wants, needs, and expectations when it comes to investment decisions. But, what is important for all of us, I believe, is to have a rational reason for buying and selling. Having a plan in place ahead of time will make that decision easier and help all of us to become better investors. If we don’t have a prearranged plan we will end up relying on our emotions or a hot tip from the barber. And, that kind of investing is sure to bring disaster to anyone’s portfolio. Additional disclosure: I’m not recommending anyone buy any stock mentioned in this article. This article is intended for educational purposes only.

A Low-Tech Index Offering Exposure To The High-Tech Sector

By Robert Goldsborough Investors craving a big helping of large-cap growth stocks with a strong tilt toward the technology sector can consider PowerShares QQQ ETF (NASDAQ: QQQ ) . A perennial favorite among U.S. large-cap growth investors, QQQ is the sixth most actively traded U.S. exchange-traded fund and has the sixth-most assets of any U.S. ETF. QQQ also offers exposure to leading Nasdaq-listed consumer discretionary firms (18% of assets) and biotech firms (15% of assets) and tracks the cap-weighted Nasdaq-100 Index, which includes the 100 largest nonfinancial stocks in the Nasdaq Composite Index. Given its narrow sector focus, this ETF would work best as a satellite holding in a diversified portfolio. This is a high-quality portfolio with a mega-cap tilt, with more than 87% of assets invested in large-cap companies and more than 93% of assets invested in companies with Morningstar Economic Moat Ratings, those that Morningstar’s equity analysts deem as having sustainable competitive advantages. However, given this fund’s sector tilts, it is more volatile than a broad portfolio of large-cap stocks. For example, over the past 10 years, it has had a volatility of return of 18.0% compared with 14.6% for the S&P 500. When considering whether to invest, investors should take note of the fact that stocks in this fund make up almost the entire 20% tech component of the S&P 500. Despite the relatively low overlap, QQQ has a high correlation in performance with the S&P 500 (90% over the past 10 years) and an even higher correlation with the large technology ETF Technology Select Sector SPDR (NYSEARCA: XLK ) (98% over the past 10 years). Fundamental View The U.S. technology sector dominates QQQ and accounts for fully 58% of its assets, and large-cap tech firms’ performance determines its fortunes. The single largest dynamic affecting the tech sector right now is the shift to mobile computing and growth in cloud computing. Mobile and cloud computing are truly disruptive forces in the tech sector. As users shift to mobile devices, PC sales continue to fall. Global PC shipments dropped by 10% in 2013 and were flat to slightly down in 2014, with developed markets stabilizing but emerging markets seeing declines, as users shift to tablets. Despite sluggishness in PC sales, the total number of devices sold is expected to rise meaningfully in the years to come, as consumers and businesses adapt to smartphones and tablets. Our analysts project that some 2.6 billion-plus computing devices will ship in 2017–more than twice the total number of devices that shipped in 2012. Across the tech sector, firms are reshaping their portfolios for this ongoing transition. Microsoft (NASDAQ: MSFT ) in 2013 acquired Nokia’s (NYSE: NOK ) handset business and has developed the Windows Phone operating system, while Intel (NASDAQ: INTC ) has invested heavily in producing microprocessors optimized for mobile devices. Apple (NASDAQ: AAPL ) leads the marketplace with its iPhone and iPad, continually gaining share from struggling competitors. And Google (NASDAQ: GOOG ) (NASDAQ: GOOGL ) long has had a dominant position in Internet search and has aggressively invested in its Android operating system for smartphones and tablets, providing it free of any license fees. Having Google software on the device helps to ensure that when users search, they use Google. Enterprise hardware suppliers also are reshaping their businesses. Broadly, we are confident in tech firms’ positioning for growth in the medium term. Tech firms generally are procyclical in their performance, and with continued economic strength, tech firms generally should do well. The Gartner Group estimates that tech spending grew 3.2% in 2014, measured in constant currency, to $3.8 trillion and forecasts a growth rate of 3.2% in 2015. As large tech firms manage and reshape their businesses to adapt to secular declines in PC demand, we expect that they will continue to find ways to benefit from smartphone and tablet growth. To be sure, not all technology players will win in a world dominated by mobile computing and cloud computing. For instance, we view cloud computing as a moderate threat to all IT infrastructure suppliers, as cloud service providers are technically savvy customers. So as enterprises migrate their infrastructure to these service providers, infrastructure suppliers’ pricing power likely will decrease. Apple makes up 13% of the assets of QQQ and is far and away this ETF’s largest holding. Apple surged in 2014 after a turbulent 2013. The company benefited from strong earnings reports and guidance that beat expectations, driven by solid iPhone unit sales in both developed markets and in China. Although iPad sales have continued to lag, investors have been enthused by the launches of two larger-screen iPhones, Apple Pay, and Apple Watch and what it means for Apple’s continued ability to innovate. We expect Apple to remain a leader in the premium smartphone and tablet markets for years to come. Portfolio Construction Known as the Cubes or the Qubes, this ETF tracks the Nasdaq-100 Index, which was created in 1985 to represent the Nasdaq Composite Index’s 100 largest nonfinancial stocks by market capitalization. The top 10 holdings account for a significant 47% of the portfolio. While Apple has a narrow moat, this ETF’s next-largest eight holdings all have wide moats. The average market cap of this fund’s holdings is about $96.6 billion. The Nasdaq-100 index rebalances once a year, although it has on occasion conducted special index rebalances in order to prevent any one company from having an outsize impact on the index (the index caps any one company’s weighting at 24%). The last special index rebalance took place in 2011 and was driven by the continued overweighting of Apple. Fees This ETF is relatively inexpensive, with an annual expense ratio of 0.20%. Its estimated holding cost is slightly higher, at 0.25%. Estimated holding costs are primarily composed of the expense ratio but also include transaction costs, sampling error, and share-lending revenue. One alternative is Fidelity Nasdaq Composite (NASDAQ: ONEQ ) , which tracks the broader Nasdaq Composite Index. ONEQ contains 1,920 stocks listed on the Nasdaq, making it a much broader portfolio than QQQ’s. Given its broader holdings, ONEQ is less top-heavy, with the top-10 names accounting for about 31.5% of total assets. ONEQ also includes Nasdaq-listed financial stocks, which make up about 6.5% of its portfolio. The average market cap of ONEQ’s holdings (about $31.5 billion) is considerably less than that of the holdings in the Cubes (about $97.0 billion). This can be attributed in part to ONEQ’s 17% exposure to small-cap stocks. ONEQ charges 0.21%, with an estimated holding cost of 0.12%. A cheaper and less volatile large-cap growth fund is Vanguard Growth ETF (NYSEARCA: VUG ) , which has an expense ratio of 0.09%. The performance of QQQ is highly correlated with the performance of VUG (96% over the past five years). Similarly, another large-growth option is iShares Russell 1000 Growth (NYSEARCA: IWF ) , which charges 0.20%. With just more than one third the holdings of ONEQ, IWF is more concentrated than the Fidelity offering. At the same time, it’s far more diverse than QQQ. Even so, QQQ’s performance is highly correlated with the performance of IWF (96% over the past five years). Those seeking more-concentrated exposure to tech names can consider Technology Select Sector SPDR ( XLK ) , which carries a 0.16% expense ratio and holds 71 companies, all of which are information technology and related services, software, telecommunications equipment and services, Internet, and semiconductors. A less-liquid alternative is Vanguard Information Technology ETF (NYSEARCA: VGT ) , which holds 393 companies and charges just 0.12%. Disclosure: Morningstar, Inc. licenses its indexes to institutions for a variety of reasons, including the creation of investment products and the benchmarking of existing products. When licensing indexes for the creation or benchmarking of investment products, Morningstar receives fees that are mainly based on fund assets under management. As of Sept. 30, 2012, AlphaPro Management, BlackRock Asset Management, First Asset, First Trust, Invesco, Merrill Lynch, Northern Trust, Nuveen, and Van Eck license one or more Morningstar indexes for this purpose. These investment products are not sponsored, issued, marketed, or sold by Morningstar. Morningstar does not make any representation regarding the advisability of investing in any investment product based on or benchmarked against a Morningstar index.