Tag Archives: investing ideas

Stocks Are Not Milk – So Don’t Invest Like They Are

I want to warn you about stock splits today – and to save you from getting bamboozled the next time a company splits its stock, like Netflix (NASDAQ: NFLX ) is scheduled to do next week. If you have ever gone grocery shopping, you might think you have a good understanding of stock splits. For example, I’m sure you have noticed that four one-quart containers of milk will cost you more than a one-gallon container. The milk company is able to create value by dividing the original gallon into smaller containers. But what works in the supermarket does not work on the stock market, despite the fact that many investors behave as if they believe it does. They become elated when they hear that a stock they own is about to split, because, like in our milk example, they believe that the sum of the parts will be worth more than the whole. Or they decide to buy into a stock because it is going to split, believing, again, that four quarts is worth more than one gallon. I have always found this behavior curious. After all, what’s the difference between owning 100 shares of a $100 stock and 200 shares of a $50 stock? There is no difference. Your total investment is worth $10,000 either way. The only reason to think otherwise would be if you believed that a stock would appreciate at a faster rate after a split than it would have without a split. However, there is no evidence to support this line of thinking. When managements are asked why they split their stock, they inevitably say that the price of the stock had gone up too high, making it unaffordable for many investors. By saying this, they are implying that there would be greater demand for the stock if only the price were lower. Those of us who studied Economics 101 would agree that for most goods, there is a relationship between price and demand. In general, the lower the price, the greater the demand. However, stocks are not like milk. You can’t create value out of stocks simply by dividing them into smaller units. A stock split changes the price per share, but it does not change the price of all the shares in aggregate. In other words, a stock split has no impact on the company’s market capitalization. If the company were in play, do you really believe the acquirer would pay a larger premium simply because the target split the stock? Of course not. Having said that, I must admit that there are times when stock splits make sense. For example, several decades ago, before there were discount brokerage firms, trading costs were extremely high. Furthermore, investors paid a penalty if they bought (or sold) less than a round lot (i.e., 100 shares). As a result, there was a significant monetary incentive to trade at least 100 shares at a time. That’s no longer the case. Trading commissions have been driven down significantly. If you can’t afford to buy 100 shares of a $1,000 per share stock, there is nothing preventing you from buying 50 shares or even 10 shares. For that reason alone, there is much less of a need for corporations to split stock. So are there any good reasons for a company to split stock these days? Sure. A stock split would make sense if the stock price were so high that even one share were unaffordable. Berkshire Hathaway Class A (NYSE: BRK.A ) shares sell for more than $200,000 each. There aren’t many investors who can afford that. It would certainly make sense for Berkshire to split the stock. The problem is that Warren Buffett, the chairman and CEO, vowed long ago to never split the shares. Yet, at one point, he realized he had a problem. So in order to avoid breaking his vow, he simply created a new “Class B” (NYSE: BRK.B ) type of share. For all intents and purposes, the creation of the Class B shares was equivalent to splitting the stock. Here’s another good reason for a split. Apple (NASDAQ: AAPL ) initiated a 7-for-1 stock split in June 2014, when the stock price was near $700 per share. That’s nowhere near Berkshire territory. Most investors could easily afford to buy 10 or even 20 shares of a $700 stock – so why the split? The answer became clear a few months after the split, when Apple was added to the Dow Jones Industrial Average. Unlike most market indexes, the Dow is not capitalization-weighted. It is price-weighted. In other words, the higher the price, the greater the impact on the index. There was no way the folks at Dow Jones were going to include a $700 stock in the index. By splitting the stock, Apple brought the stock price down to a level that was comparable to several of the Dow’s other components. The split made Apple eligible for membership in one of the most prestigious market indexes. Finally, there is one other valid reason why companies might want to split their stock. A stock split can be an effective way for management to signal its optimism to the market. It’s one thing for the CEO to state that he or she is bullish about the company’s prospects. It’s a completely different thing to actually signal that optimism by splitting the stock. In this case, a stock split is like putting your money where your mouth is. Management would not be likely to initiate a split if it thought the company was about to run into a rough patch. Here’s my advice on stock splits. Don’t buy a stock just because the company announces a split. A split might cause a brief rally, but there are more important factors that will have a stronger impact on the stock price over the long term. Perhaps this is best exemplified by recent events at Netflix. The company announced a 7-for-1 stock split right after the market closed on June 23. Not surprisingly, the immediate reaction was euphoric. The stock surged significantly higher in after-hours trading. Yet, by the end of the following day, shares of Netflix were trading lower, and they have continued to drift lower ever since. It turns out that Carl Icahn had liquidated his entire position in the company, suggesting he thought the shares were no longer undervalued. That’s more important than how many quarts are in a gallon.
YLCO – Leveraging On The Growth Of The YieldCo Investment Class

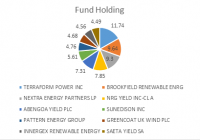
Summary YieldCos are an emerging asset class of yield vehicles, providing stable and growing dividend income from renewable energy assets. The ETF portfolio consists of high quality yieldco securities. The Global X YieldCo Index ETF is a low risk way to play the high growth renewable energy. The Global X YieldCo Index ETF (NASDAQ: YLCO ) is a new ETF investing in yieldcos as the underlying asset. It was formed by the Global X Funds, one of the largest issuers of ETFs providing investment opportunities across the global markets. This ETF provides a good opportunity for investors looking to invest in the renewable energy sector including solar and wind companies. YieldCos are becoming important especially in the solar industry. Many big solar companies have made plans to form a yieldco. YieldCos are dividend growth oriented public companies, providing stable cash flows and distributing the cash amongst its shareholders as dividends. YLCO will be the first YieldCo ETF available to U.S. investors. ETF Details The fund started on May 27, 2015 and has an expense ratio of 0.65%. The ETF follows the Indxx Global YieldCo Index, which is the underlying index. It will have to invest at least 80% of its total assets in the securities of the underlying index. It follows a replication strategy, where investment in securities will be done in the same proportion as the underlying asset; not trying to outperform or underperform. Since the Global YieldCo Index focuses on the energy sector, the new ETF will also concentrate on the energy sector. The Global YieldCo Index currently has a yield of over 3%. This fund is different from the rest as it seeks to invest in yieldcos. Why should you invest in a Renewable Energy YieldCo 1) Renewable Energy is growing rapidly Renewable energy usage has been scaling up in recent times. With solar energy reaching grid parity in a number of places, it is now becoming more economical to use solar power rather fossil fuels. Countries are focusing on reducing their carbon footprint by using more renewable energy. Developing countries like China and India have made aggressive plans to shift their energy mix from coal to more cleaner and efficient energy sources like wind and solar. Energy companies are bound to benefit in the future from these long term trends. According to Solar PV roadmap by IEA, solar energy capacity will grow to 3000 GW by 2050 up from 184 GW now. 2) YieldCos are becoming popular YieldCos are fast gaining traction in the renewable energy space. It is created by a parent company to lower the cost of capital, as renewable energy projects are capital intensive. Green energy does not require fuel and most of the cost is front loaded. The capital cost is the most crucial variable in determining the levelized cost of electricity (LCOE). The income from these yieldcos is considered reliable and some of the yieldcos are also growing rapidly e.g. Terraform Power (NASDAQ: TERP ). YieldCos distribute the cash amongst investors in the form of dividends. YieldCos have become extremely popular in this industry today. They enter into long term contracts and thus provide stable cash flows. This industry currently has a combined market capitalization value of $39 billion currently and 11 more IPOs are in the pipeline. 3) Top 10 Fund Holding The fund holds 20 securities with the top holding Terraform Power Inc. accounting for as much as 12%. TERP was the first yieldco formed by SunEdison (NYSE: SUNE ) in the solar energy space, which revolutionized the whole industry. The company’s portfolio has grown from 808 MW since its IPO in July 2014 to 1,675 MW. It has plans to diversify into natural gas, geothermal and hydro power. The CAFD guidance more than doubled to $225 million for 2015 . Another big holding is Brookfield Renewable Energy Partners which owns $20 billion in renewable power assets and is a leading operator of renewable projects across North America, Latin America and Europe. It has installed more than 7GW capacity predominantly in the hydroelectric space. The 3rd largest holding is NextEra Energy Partners (NYSE: NEP ) which owns clean energy projects particularly wind and solar energy in North America with stable, long-term cash flows. It declared $100-120 million as its CAFD guidance for 2015 and is expecting a 12-15% annual growth in dividend distribution over the next five years. Data from Global X Funds 4) Geographic Diversification Though the fund has a global footprint, the focus in mainly on the developed countries. The main reason for this concentration is the fact that yieldcos have been launched mainly in these regions. Emerging markets do not have major yieldcos as of now. As time passes, I expect yieldcos to emerge in the developing markets as well. Data from Global X Funds Index Characteristics (click to enlarge) Source: Indxx Risks One of the concerns of investing in this ETF could be the fact that the underlying assets are not fully under the control of its management. They are dependent on their sponsors. For example, if the sponsors do not have a healthy project pipeline, they will be unable to transfer the assets to their underlying yieldco which may adversely affect the yieldco’s performance and in turn the ETF’s. Other than this, it is a relatively new concept in the industry and like any other new venture there is this risk of whether it will be a success or a failure. But given the high quality stocks in the Global X YieldCo portfolio, I do not think it should be a major concern. Stock performance The Global X YieldCo Index ETF was launched on May 27, 2015 at $15.35 and is currently trading at ~$15. Conclusion Investing in renewable energy stocks is sometimes regarded as risky given the volatile nature of the sector. ETFs are a good way to diversify individual stock risks and are regarded as less risky. The Global X YieldCo Index ETF is a good and balanced way to stay invested in the green space, giving exposure to the growing yieldco market. It is a relatively new concept in the market now and has been launched by one of the fastest growing issuers of ETFs. I think it’s a smart way of investing in the renewable energy space as it is less risky and involves a portfolio of growing stocks. Disclosure: I/we have no positions in any stocks mentioned, and no plans to initiate any positions within the next 72 hours. (More…) I wrote this article myself, and it expresses my own opinions. I am not receiving compensation for it (other than from Seeking Alpha). I have no business relationship with any company whose stock is mentioned in this article.

The Great Recalibration: The Appearance Of Risk Aversion In Credit Spreads And Equity ETFs

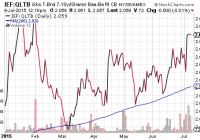
I have noticed a trend toward risk aversion that may adversely affect U.S. stocks. Investors may be in the process of adjusting their expectations for what central banks in Europe, Asia and the United States are capable of achieving. Sure, central banks may try to prevent recessions; they may attempt to inflate stock prices, decrease borrowing costs and/or depreciate currencies. In the end, though, their powers may extend no further than the collective confidence of market participants. Investors have seen a great deal of volatility in U.S. treasuries over the past six months. Early in the year, the combination of recessionary data stateside as well as quantitative easing (QE) measures in Europe helped propel demand for U.S. sovereign debt. Then came the massive unwind, alongside Fed hints at upcoming rate hikes; treasury yields spiked. More recently, the Greece default and the market meltdown in China gave treasuries their groove back. At present, the 10-year yield (2.25%) sits pretty darn close to where it sat at the start of 2015. If I had to project where that yield would be at the end of the year, I’d tell you that it might move up, down and around, but that it would ultimately be near where it is today. I feel the same way about the greenback. In essence, I anticipate that the U.S. dollar may jump around, but that it will not move substantially higher or lower over the next 6 months. In other words, irrespective of financial system shocks, geopolitical uncertainty or central banker gamesmanship, both the buck and the 10-year may be directionless. If I see little reason to invest in the greenback or bet against it, if I do not see value in adding meaningfully to treasuries in a portfolio or betting against them, why discuss U.S. sovereign debt or the U.S. currency at all? Primarily, I have noticed a trend toward risk aversion that may adversely affect U.S. stocks. Take a look at the price ratio between treasuries and crossover corporates – U.S. company bonds that span the lowest end of investment grade (Baa) universe through the highest-rated “junk” (Ba) arena. One can do this by comparing the iShares 7-10 Year Treasury Bond ETF (NYSEARCA: IEF ) with the iShares Baa-Ba Rated Corporate Bond ETF (BATS: QLTB ). In essence, since March, there have been higher lows in the price ratio and a consistent ability for IEF:QLTB to maintain above its long-term trendline. Moreover, the momentum in IEF:QLTB indicates a widening in credit spreads such that investors may be increasingly turning toward the return of capital over a return on capital. The credit spread evidence is hardly an indication of blood in the streets of Pamplona. Nevertheless, the iShares MSCI Spain Capped ETF (NYSEARCA: EWP ) sits near 2015 lows; its current price is well below a long-term 200-day moving average. Indeed, investors may be doubting the ability of the European Central Bank (ECB) to find a path forward. It is one thing to express a desire to “do whatever it takes” to preserve the euro-zone. It is another thing to keep debt-fueled excesses from fracturing alliances. Granted, the People’s Bank of China (PBOC) may eventually contain the fallout from the lightning quick collapse of Chinese equities in Shanghai. And central bankers may yet find a way to kick the toxic debt can down a European cobblestone path; that is, a disorderly “Grexit” for Greece is not an absolute certainty. Even the upswing in S&P 500 VIX Volatility (VIX) is merely a sign that folks are willing to pay a little bit more for index option protection than they were a few weeks earlier. On the other hand, the deterioration in U.S. stock market internals has been decidedly bearish. Both the NYSE Composite and the S&P 500 have significantly more 52-week lows than 52-week highs. Similarly, the number of advancing stocks relative to the number of declining stocks for both indexes has been steadily dropping since mid-May. What these breadth indicators tell you is that fewer and fewer stocks are carrying the entire ship. Like Atlas trying to hold the weight of the world on his shoulders, should he shrug, the benchmarks may buckle. If nothing else, we may be witnessing a “Great Recalibration.” (Did I just come up with a new term?) Investors may be in the process of adjusting their expectations for what central banks in Europe, Asia and the United States are capable of achieving. Sure, central banks may try to prevent recessions; they may attempt to inflate stock prices, decrease borrowing costs and/or depreciate currencies. In the end, though, their powers may extend no further than the collective confidence of market participants. Here’s a look at one last chart that supports the notion that the smarter money may be moving toward risk-off assets. On a month-over-month basis, the FTSE Multi-Asset Stock Hedge (MASH) Index is outperforming the S&P 500. The MASH Index is a collection of non-stock assets that tend to do well in bearish environments, including the yen, the franc, munis, long duration treasuries, inflation-protected securities, German bunds and gold. Disclosure: Gary Gordon, MS, CFP is the president of Pacific Park Financial, Inc., a Registered Investment Adviser with the SEC. Gary Gordon, Pacific Park Financial, Inc, and/or its clients may hold positions in the ETFs, mutual funds, and/or any investment asset mentioned above. The commentary does not constitute individualized investment advice. The opinions offered herein are not personalized recommendations to buy, sell or hold securities. At times, issuers of exchange-traded products compensate Pacific Park Financial, Inc. or its subsidiaries for advertising at the ETF Expert web site. ETF Expert content is created independently of any advertising relationships.