Tag Archives: investing ideas

VMBS Is An Attractive Buy
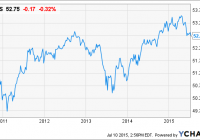
Summary Federally Backed Mortgage Backed Securities Offer Comparably Attractive Returns. VMBS Has Low Fees And Holds High Quality Bonds. VMBS Is An Affordable Option For Investing In The Mortgage Securities Market. Introduction Balance is an essential aspect of investing. In the spirit of diversification, I’ve spent a measurable amount of time imploring investors to weigh the benefits of alternative investments. I’ve harped on about ETNs, inverse treasury hedging tools, and ETFs. In this article I hope to analyze the benefits of one particular ETF, the Vanguard Mortgage-Backed Securities Index ETF (NASDAQ: VMBS ). There are eight widely recognized mortgage backed securities ETFs, but there are 3 that I consider to be “investable.” They include the iShares MBS ETF (NYSEARCA: MBB ), the iShares CMBS ETF (NYSEARCA: CMBS ), and VMBS . Federal issued mortgage securities offer safe long term fixed income returns. Typically, the barrier to entry to buy an individual MBS is around $25,000. For this reason an ETF may be a more realistic option for the average investor. Now let’s take a closer look at what makes VMBS an attractive buy. Why Mortgaged Backed Securities Mortgage backed securities are safe investments that offer an optimal source of fixed income. VMBS tracks the performance of the Barclays Capital U.S. MBS index. VMBS is extremely safe because it only holds bonds issued by Ginnie Mae, Fannie Mae ( OTCQB:FNMA ), and Freddie Mac ( OTCQB:FMCC ). Fannie Mae and Freddie Mac are publicly traded companies that offer agency guarantees with the backing of the U.S. government, and Ginnie Mae mortgage securities are backed by the full faith and credit of the U.S. government. Mortgaged backed securities offer returns in excess of 1-2% above U.S. Treasuries. However, MBS do not have the same tax advantages as Treasuries (which should be individually factored into the net return). Investors looking for a safe and highly performing alternative to Treasuries should consider investing in mortgage backed securities. VMBS Analysis VMBS is a strong MBS ETF with solid underlying assets, optimal yields, and a low expense ratio. VMBS’s competitors hold a mere 48.81% in AAA rated bonds. Conversely, VMBS’s bond portfolio is 100% AAA rated bonds. The bonds that VMBS holds have an average effective duration of 3.24 years and an average effective maturity of 5.60 years. The average weighted coupon is 3.85%. Currently VMBS is priced at 106.45. VMBS is the second largest MBS ETF with over 1.45 Billion in total assets. VMBS’s total assets are second only to MBB. MBB however holds marginally lower quality bonds, and MBB has a higher expense ratio. Below VMBS is CMBS which holds 179 million in total assets. VMBS has one of the lowest expense ratios at 0.12% (which prevents cash flows getting siphoned off to cover fees). VMBS’s net SEC yield is attractive at 1.43%, and VMBS is extremely liquid as well with an average volume of 206,475. Forward Strategy A high quality fund with strong assets such as VMBS will perform optimally over its competitors in a rising interest rate environment. Janet Yellen just promised rates would rise later this year, so it is important to consider the consequences interest rates will have. I think an MBS ETF is a strong addition to a well balanced portfolio. I should note, however, that bond prices are inversely correlated to rising rates, so it is possible to see some marginal capital depreciation. On the other hand, this would likely mean VMBS’s SEC yield would increase. AAA rated bonds are less risky, and therefore maintain their value in a variety of changing environments. For this reason, I believe VMBS will perform optimally in years to come. Conclusion Consider a safe source of income that outperforms Treasuries. There are capital barriers to entry in the primary and secondary mortgage backed securities market. However, VMBS is an attractive and affordable ETF that provides broad based coverage to any investor. VMBS has strong holdings, and it is a conservative investment that won’t disappoint. Editor’s Note: This article discusses one or more securities that do not trade on a major U.S. exchange. Please be aware of the risks associated with these stocks. Disclosure: I/we have no positions in any stocks mentioned, and no plans to initiate any positions within the next 72 hours. (More…) I wrote this article myself, and it expresses my own opinions. I am not receiving compensation for it (other than from Seeking Alpha). I have no business relationship with any company whose stock is mentioned in this article.

Mutual Funds In Focus Ahead Of Q2 Earnings Season

The first quarter earnings season was not very encouraging and the official commencement of the second quarter earnings season too had a dismal start. After beating bottom-line estimates for four consecutive quarters, aluminum giant Alcoa (NYSE: AA ) finally missed the earnings estimates. To add to the disappointment, the second quarter estimates have been moving lower. Management has consistently provided lower guidance. On that note, it can be said that under promising is a good thing to come out with outperforming results. The declining trend in second quarter earnings is not unique this time though. Also, the magnitude of lower revisions this time is lower compared to the trend ahead of the first quarter. The spotlight is already on the second quarter earnings, and the action heightens starting next week. Before we brace ourselves for a very busy next couple of weeks, let’s look at some buy-ranked mutual funds that boast high average EPS growth. Q2 Earnings Expectations Earnings for the S&P 500 components are projected to decline 6.7% year on year while revenues may drop 6%. Growth is projected to suffer across 9 out of 16 sectors. These 9 sectors may incur earnings decline. Again, the energy sector might be the biggest laggard as earnings for the sector may slump 64% with a decline of 41.5% in revenues. Finance sector however is expected to see 2.6% higher earnings, though sales may drop 5%. Technology on the other hand may incur a 1.6% drop in earnings, but revenues will improve 0.8%. Meanwhile, taking the energy sector out, total earnings for the S&P 500 may edge up 0.5% with 0.3% decline in revenues. Despite negative revisions, and as mentioned earlier, the magnitude of revisions downward in second quarter is lower than first quarter. For the second quarter, the magnitude of negative revision is 3.1%. This compares favorably with 8.3% lower revisions in first quarter 2015 and 5.9% in first quarter 2014. Run Up to the Second Quarter The first quarter had major headwinds to deal with. The GDP numbers were not so impressive and companies had a lot to worry about stronger dollar. Strength in the U.S. dollar had a huge impact on the trade deficit over the first quarter. While a stronger dollar dragged down the export demand in the first quarter, it also boosted import demand as it made foreign goods cheaper. The ‘dollar scapegoating’ was a theme in reading the first quarter results. Weakness in first quarter earnings numbers was attributed to the strength of the dollar. The large-cap S&P 500 companies earn about 40% of their revenues from outside the US. Total first quarter earnings for the 498 S&P 500 members were up 2.4% on 3.3% lower revenues. Only 62% could beat EPS estimates and only 42.4% outperformed revenue expectations. This time however, the dollar should be of greater importance. In the run up to the second quarter, markets were mostly worried about the Greece debt deal crisis. However, this should not affect the US multinationals. Also, the economy has been promising this time, with quality data from housing and retail sectors. 5 Mutual Funds with the Best Average EPS Growth Below we present 5 mutual funds that currently have the best average EPS growth. These funds carry either a carry a Zacks Mutual Fund Rank #1 (Strong Buy) or Zacks Mutual Fund Rank #2 (Buy). Remember, the goal of the Zacks Mutual Fund Rank is to guide investors to identify potential winners and losers. Unlike most of the fund-rating systems, the Zacks Mutual Fund Rank is not just focused on past performance, but the likely future success of the fund. The minimum initial investment is within $5000. These funds are not only in the green so far this year, but have positive total return over the last 1, 3 and 5 year periods. Fidelity Select Medical Delivery Portfolio (MUTF: FSHCX ) seeks long-term capital growth. FSHCX invests a major portion of its assets mainly involved in operations related to hospitals, nursing homes and other organizations engaged in providing health care services. FSHCX primarily focuses on acquiring common stocks of companies throughout the globe. FSHCX currently carries a Zacks Mutual Fund Rank #2. The year-to-date and 1-year gains are 13.3% and 30.8%. Meanwhile, the 3 and 5 year annualized returns are 24.4% and 22.3%. The annual expense ratio of 0.79% is lower than the category average of 1.37%. The average EPS growth is 22.4%. Among the top five holdings, UnitedHealth Group (NYSEARCA: UHN ), McKesson (NYSE: MCK ), Cigna (NYSE: CI ) and Cardinal Health (NYSE: CAH ) have average earnings surprise for the past four quarters of 8.3%, 6.4%, 5.5% and 4.1%. Rydex S&P SmallCap 600 Pure Growth Fund (MUTF: RYSGX ) seeks results that are at par (excluding fees and expenses) with the S&P SmallCap 600 Pure Growth Index’s performance. A lion’s share of its assets is invested in the common stock of companies listed on the underlying index. RYSGX currently carries a Zacks Mutual Fund Rank #2. The year-to-date and 1-year gains are 9.3% and 9.6%. Meanwhile, the 3 and 5 year annualized returns are 16.4% and 17.2%. The annual expense ratio of 1.51% is however higher than the category average of 1.35%. The average EPS growth is 19.5%. Among the top five holdings, Lannett (NYSE: LCI ), Skechers USA (NYSE: SKX ), Taser International (NASDAQ: TASR ), Gentherm (NASDAQ: THRM ) and Take-Two Interactive Software (NASDAQ: TTWO ) have average earnings surprise for the past four quarters of 4.7%, 22.5%, 50.6%, 27.5% and 88.9%. Fidelity Independence Fund (MUTF: FDFFX ) invests primarily in common stocks of domestic and foreign issuers. FDFFX realizes capital gains without considering the tax consequences to shareholders. The management is not constrained by any particular investment style and may invest in either ‘growth’ stocks or ‘value’ stocks or both. FDFFX currently carries a Zacks Mutual Fund Rank #2. The year-to-date and 1-year gains are 3% and 4.7%. Meanwhile, the 3 and 5 year annualized returns are 20.7% and 17%. The annual expense ratio of 0.73% is lower than the category average of 1.19%. The average EPS growth is 19.4%. Among the top five holdings, Apple (NASDAQ: AAPL ), Gilead Sciences (NASDAQ: GILD ), Medivation (NASDAQ: MDVN ), Celgene (NASDAQ: CELG ) and American Airlines Group (NASDAQ: AAL ) have average earnings surprise for the past four quarters of 9.6%, 15.5%, 23.2%, 4.2% and 1.6%. Fidelity Select Leisure Portfolio (MUTF: FDLSX ) seeks capital growth. FDLSX invests at least 80% of assets in common stocks of companies principally engaged in the design, production, or distribution of goods or services in the leisure industries. FDLSX currently carries a Zacks Mutual Fund Rank #1. The year-to-date and 1-year gains are 7.2% and 13.4%. Meanwhile, the 3 and 5 year annualized returns are 19.7% and 19.6%. The annual expense ratio of 0.8% is lower than the category average of 1.48%. The average EPS growth is 18.3%. Among the top five holdings, Starbucks (NASDAQ: SBUX ), Yum! Brands (NYSE: YUM ), Chipotle Mexican Grill Inc (NYSE: CMG ) and Wyndham Worldwide (NYSE: WYN ) have average earnings surprise for the past four quarters of 0.8%, 1.5%, 7.8% and 5.1%. Janus Forty Fund (MUTF: JDCAX ) invests in a group of 20-40 common stocks that have growth potential. JDCAX may invest in companies of all sizes, ranging from prominent firms to smaller and emerging growth firms. JDCAX currently carries a Zacks Mutual Fund Rank #1. The year-to-date and 1-year gains are 6.3% and 15.8%. Meanwhile, the 3 and 5 year annualized returns are 17.9% and 15.1%. The annual expense ratio of 0.92% is lower than the category average of 1.19%. The average EPS growth is 17.7%. Among the top five holdings, Lowe’s Companies (NYSE: LOW ), Delphi Automotive PLC (NYSE: DLPH ), Valeant Pharmaceuticals International (NYSE: VRX ) and Endo International PLC (NASDAQ: ENDP ) have average earnings surprise for the past four quarters of 0.7%, 4.2%, 80.4% and 6.6%. Link to the original article on Zacks.com

4 Worst Performing U.S. Equity ETFs So Far In 2015

The U.S. stock market is caught in a bull-bear tug of war this year. On the one hand, the domestic economy has been on a moderate growth path as reflected in increased consumer confidence, higher spending power, renewed optimism in housing recovery and an improving job market. Additionally, a wave of mergers and acquisitions are brightening up the stock world. On the other hand, Fed uncertainty, an aging bull market, lofty stock valuations, strong dollar, lower oil prices, and global growth concerns including Greece crisis and China slowdown are awakening the bear. As a result, both major indices – the S&P 500 and Dow Jones – are in the red territory from a year-to-date look, declining 0.4% and 1.5%, respectively. In fact, a number of products have been crushed by this tug of war, piling up huge losses for many ETFs. Below, we have highlighted four ETFs that have been hit badly in the volatile environment and might continue their rough trading in the months ahead if the same trends persist. C-Tracks ETN on CVOL (NYSEARCA: CVOL ) – Down 41.3% Volatility products have been the biggest laggard this year despite the bouts of volatility seen in the market. This is because these products tend to outperform when markets are falling or fear levels over the future are high, but neither of this has happened lately. While global headwinds tried to dominate the market, upbeat economic data and the Fed continued to fuel a rally at regular intervals. Given this, CVOL – linked to the Citi Volatility Index Total Return – was the hardest hit, having lost over 41% in value so far in the year. The note provides investors direct exposure to the implied volatility of large-cap U.S. stocks. The benchmark combines a daily rolling long exposure to the third and fourth month futures contracts on the CBOE Volatility Index with short exposure to the S&P 500 Total Return Index. The ETN is unpopular and illiquid in the volatility space with AUM of $4.5 million and average daily volume of less than 102,000 shares. It charges a slightly higher 1.15% in annual fees from investors. Market Vectors Coal ETF (NYSEARCA: KOL ) – Down 29.9% Coal has been out of investors’ favor over the past few years on the thriving alternative energy space and weak global industry fundamentals. The depletion of fossil fuel reserves, global warming and high fuel emission issues, new and advanced technologies as well as more efficient applications is making clean power more feasible, reducing the demand for the black diamond. These are making it difficult for the coal miners to sustain their profitability and margins. As a result, the ETF targeting the global coal industry has seen a wild ride and was off nearly 30% so far this year. It tracks the Market Vectors Global Coal Index. Holding 32 securities in the basket, the fund is concentrated on the top 10 holdings at 60.8% of total assets. It definitely has a U.S. focus as roughly 35% of the fund goes to the American stocks. Beyond that, the Asia and Asia-Pacific region combined to make up for 58% share. The fund has amassed $70 million in its asset base and trades in average daily volume of 77,000 shares. Expense ratio came in at 0.59%. KOL has a Zacks ETF Rank of 5 or ‘Strong Sell’ rating, suggesting their continued underperformance in the coming months. SPDR S&P Metals and Mining ETF (NYSEARCA: XME ) – Down 26.6% The other major losers in the equity world year-to-date are the metal & mining stocks and ETFs thanks to plunging metal prices and weak global trends. Acting as leveraged plays on underlying metal prices, metal miners tend to experience huge losses than their bullion cousins in the slumping metal market. In particular, a strong U.S. currency is making dollar-denominated assets more expensive for foreign investors, thereby dulling the appeal for these commodities. The ETF offers broad exposure to the U.S. metal and mining industry by tracking the S&P Metals & Mining Select Industry Index. Holding 34 stocks in its basket, it uses an equal weight methodology and does not put more than 4.53% of assets in a single security. In terms of industrial exposure, steel makes up for large chunk at 42.7%, while diversified metals and mining, aluminum, and coal & consumable fuels round out the next three spots with double-digit allocation each. The product has $263.3 million in AUM and trades in solid trading volumes of nearly 1.9 million shares per day on average. It charges 35 bps in fees and expenses and has lost about 26.6% so far in the year. First Trust ISE-Revere Natural Gas Index ETF (NYSEARCA: FCG ) – Down 22.7% Natural gas has been following the similar path that of the crude oil. After showing some stabilization at the start of the second quarter, the commodity again lost its charm in recent weeks due to a combination of factors. The shale oil boom in the U.S., increased production, supply glut and reduced demand are pushing natural gas prices and the related ETFs lower. FCG, which offers exposure to the U.S. stocks that derive a substantial portion of their revenues from the exploration and production of natural gas, is down nearly 23% in the year-to-date time frame. It follows the ISE-REVERE Natural Gas Index and holds 29 stocks in its basket, which are well spread out across components with none holding more than 4.89% share. The fund has amassed $197.3 million in its asset base while charging 60 bps in annual fees. Volume is good with more than 843,000 shares exchanged per day on average. The ETF has a Zacks ETF Rank of 4 or ‘Sell’ rating with a High risk outlook. Link to the original article on Zacks.com