Tag Archives: investing ideas

Global X Serves Up A New Alternative ETF

By DailyAlts Staff Global X Funds has a growing line of “SuperDividend” ETFs, and the latest is sure to be of interest to liquid alts investors: the Global X SuperDividend Alternatives ETF (NASDAQ: ALTY ) , which began trading on the Nasdaq on July 14. The ETF is the sixth in Global X’s SuperDividend ETF series and is designed to closely track the INDXX SuperDividend Alternatives Index. The underlying index tracks the performance of the highest dividend-yielding securities in each category of alternative income investments, as defined by index sponsor INDXX. This includes MLPs (master limited partnerships), REITs (real estate investment trusts), BDCs (business development companies), and other nontraditional income-producing investments. The Global X SuperDividend Alternatives ETF’s aim is to provide income from alternative sources with low correlation to dividend stocks and other traditional income investments. The strategy also seeks to limit volatility by screening for lower-volatility investments and overweighting categories that have been less volatile, historically. “The alternatives space encompasses a broad range of investments with risks, returns and correlations that differ from traditional equity and fixed income securities,” said Jay Jacobs, research analyst at Global X Funds, in a recent statement. “Investors are increasingly looking for alternative solutions that can potentially generate high income while diversifying their portfolios. Applying the SuperDividend approach to the alternative income space is a natural extension of our suite.” In practice, the Global X SuperDividend Alternatives ETF carries exposure to MLPs and other infrastructure companies, REITs and other real estate investments, alternative managed portfolios, and fixed-income and derivative strategies. As of July 13, REITs accounted for the largest share of the fund’s holdings at over 26%, while private equity and BDCs accounted for the next-largest share at over 19%. MLPs constituted less than 9% of the fund’s holdings, according to the fund’s fact sheet . On the downside, the Global X SuperDividend Alternatives ETF’s expense ratio is rather high at 3.03%. This is largely a function of the fact that the fund invests in other funds, according to ETF.com , and, as required, includes the underlying expense ratios of those fund in its expense ratio.
Why Optimal Portfolios Are So Difficult To Create

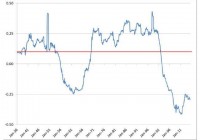
Harry Markowitz won a Nobel Prize in Economics in 1990 for his work on a theory of portfolio management for individual wealth holders. Since that time, Modern Portfolio Theory (MPT) has become the bedrock for creating best-practice portfolio selection methods. Creating an optimal portfolio consists of estimating a portfolio’s future risk and expected return as accurately as possible, based on a variety of inputs. It’s that “as accurately as possible” qualifier that makes the exercise a substantial challenge. MPT requires an investor (or his or her portfolio manager) to: Input expected asset class returns. Estimate the covariances between asset classes, or equivalently, the standard deviations and estimated correlations among asset classes. Decide on portfolio constraints, meaning the limits on the amount going into each asset class. Investors can then compare potential optimal asset allocations for the level of risk they are seeking for their overall portfolio. While there is extensive literature on MPT, accurately projecting an optimal portfolio forward strikes me as nearly impossible. The problem is the estimates. What goes into forecasting an optimal asset allocation has a big impact on what comes out. This often results in suggested optimal allocations that are quite inaccurate, and may lead to portfolio decisions that are counter-productive. Most MPT analysis relies on historical return, risk, covariance and correlation, at least as a starting point. We know that past data can be period-sensitive, so these estimates are often adjusted based on subjective input factors. Investors may have broad views of future Federal Reserve interest rate policy or of the future equity risk premium (ERP). This range of opinion can add wide variability to the accuracy of the outcome. Using only historical data for covariance and correlation can lead to large errors in portfolio optimization. For example, the long-term average correlation between US stocks and 5-year Treasury bonds from 1926-2014 has been +0.1 (correlation ranges from +1.0 to -1.0). However, an analysis of rolling correlation shows this average is far from stable. The 10-year correlation passes through +0.1 on rare occasions, but isn’t there for long. Figure 1 highlights the long-term average correlation (red line) between US stock and 5-year Treasury bond returns using monthly data from January 1936 through September 2014, and the rolling 10-year correlations (blue line) over the same period. Correlation is dynamic, not stable. When you measure correlation and how you measure it has a large bearing on the optimization output. Figure 1: Rolling 10-year Correlation of US stocks and 5-year T-bonds (click to enlarge) Source: CRSP Total US market and Treasury data from Dimensional Fund Advisors, figure by Rick Ferri Markowitz acknowledges the problem of using inaccurate correlation estimates for portfolio optimization in a recent paper he co-authored: ” Enhancing Multi-Asset Portfolio Construction Under Modern Portfolio Theory with a Robust Co-Movement Measure ” by Sander Gerber, Markowitz and Punit Pujara. The authors then attempt to address the issue with a more complex approach to estimating this variable. While the analysis is beyond the scope of this article, it’s fair to say that accurately estimating future correlation is a difficult problem for investors who are trying to solve the optimization puzzle. There are other ways to estimate portfolio risk and return that circumvent correlation estimates. One way is to assume there is no efficient frontier . Each asset class used in a portfolio has its own expected risk and return, and a portfolio of asset classes has an expected risk and return based on the weighted average risk and return of each asset class used in the portfolio. There is no assumed benefit from MPT. The weighted average method to estimating a portfolio’s overall risk and return may be a throwback in time, but it is conservative and does eliminate errors from inaccurate asset class covariance or correlation forecasts. You can read more about this method in my book All About Asset Allocation . Portfolio optimization sounds elegant in theory, but using it in practice is another matter. To have a useful outcome, MPT methodology requires an investor to input accurate asset class expected returns, standard deviation, and covariance or correlation among asset classes. That’s a tall order. Perhaps additional research such as the paper mentioned herein will help, but I’m not betting my retirement savings on it. Disclosure: Author’s positions can be viewed here .

4 ETFs To Watch This Earnings Season

Now that foreign concerns are out of the way, U.S. investors can again focus on corporate earnings to determine stock prices. This earnings season doesn’t look to disappoint either, as it could be the last before a Fed rate hike, while volatility in various commodity markets could make for some interesting outlooks in the near term. In particular, though, I am watching the following four ETFs, as these could be bellwethers this earnings season, thanks to recent trends and the status of some of their top components: iShares U.S. Oil & Gas Exploration & Production ETF (NYSEARCA: IEO ) – The oil market has been very volatile lately, and the exploration and production side can see wild trading. That is why this Zacks ETF Rank #3 (Hold) fund could really go either way this earnings season, as more pain could be ahead, or it may be the start of a turnaround. Market Vectors Semiconductor ETF (NYSEARCA: SMH ) – Semiconductors are having trouble establishing any rhythm these days, with a number of conflicting reports hitting this sector. Concerns over demand are followed by M&A activity, leaving little except for earnings to balance out investor perceptions. iShares U.S. Regional Banks ETF (NYSEARCA: IAT ) – Regional banks are an interesting choice in this market environment, as interest rates are finally starting to rise off of multi-year lows. And with important Fed meetings coming, companies in banking ETFs will have important outlooks making for a vital earnings season. SPDR S&P Metals and Mining ETF (NYSEARCA: XME ) – The metal and mining industry has been an awful spot for investment lately, as prices for a variety of commodities have crashed. The fund has lost over 25% of its value this year alone, so the earnings season will be key to shutting down this trend for this beleaguered industry. Are you looking for more on earnings? Make sure to check out the video below, which details the four ETFs highlighted above and some of the key companies to watch in these markets: Original Post Share this article with a colleague