Tag Archives: investing ideas

ETFs To Play 3 Undervalued Sectors

Though a mountain of woes punctured the U.S. market momentum in the first half of 2015 with the S&P 500 barely adding gains thanks to global growth worries, rising rate concerns and specifically the strength of the dollar, the second half looks to be shaping up in a great way. Greece worries have tailed off as the nation somehow managed to strike a debt deal with its international lenders, in turn soothing the nerves of global investors. Back home, the all-important Q2 earnings season got off to a strong start with Finance sector – the backbone of any economy – living up to expectations. All these once again fueled up the market with the Nasdaq registering consecutive record highs in mid-July and the S&P 500 trading at just 0.3% discount to its all-time high hit in May due to the massive rally we’ve seen since for the last six years. So, one might wonder if any value sector is left at all. A value play is especially required given the disappointing earnings string from a few tech bellwethers that has made investors jittery. No doubt, with all the major indices trading at around all-time highs, it is hard to find value plays at home. But for those investors fervently looking for undervalued sectors, there are still a few hidden treasures out there. While several indicators are used to examine any stock or sector’s valuation status, price-to-earnings ratio or P/E has been the most widespread. We have identified three sector picks having the lowest forward P/E ratio for this year’s earnings in the pack of 16 S&P sectors classified by Zacks and detail the related ETFs to play those sectors’ undervalued status. Auto – First Trust Nasdaq Global Auto ETF (NASDAQ: CARZ ) The U.S. automotive industry is accelerating with rising income, persistently lower energy prices, a low interest rate environment, and growing consumer confidence. All these drove auto sales 4.4% higher to 8.52 million units in the first half of 2015, signifying the best six months in a decade. And if this was not enough, auto sales are likely to hit 17 million in full-year 2015, a level never touched in the last 15 years. Despite strong fundamentals, the sector has a P/E ratio of 10.8 times for 2015 and 9.3 times for 2016, the lowest in the S&P universe, as per the Zacks Earnings Trend issued on July 16. Investors should note that the P/E of auto industry trades at 41.3% discount to the current year P/E of S&P and 43.6% discount to the next year P/E. The space is down 4.5% so far this year which says that it is time to turn its loss into your gains. Investors should note that there is only a pure play CARZ in the space that provides global exposure to nearly 40 auto stocks by tracking the Nasdaq OMX Global Auto Index. CARZ has a Zacks ETF Rank #2 (Buy) and is up 1.2% so far this year (as of July 20, 2015). Finance – Vanguard Financials ETF (NYSEARCA: VFH ) The financial sector has set an upbeat tone this earnings season. Several factors including fewer litigation charges, effective cost control measures, loan growth and investment banking activities have given Q2 earnings a boost and made up for still-the low interest rate environment which has long been bothering the sector’s revenue backdrop. Investors should also note that the Fed is preparing for an interest rate lift-off which will pave the way for financial stocks and the related ETFs going forward. The space has a current-year P/E of 14.3 times, a 22.3% discount to the S&P while its next year P/E stands at 13.1 times, a 20.6% discount to the S&P 500’s 2016 P/E. The space has added 2.2% so far this year (as of July 20, 2015). While there are plenty of financial ETFs, investors can take a look at Zacks #1 (Strong Buy) ETF VFH. This $3.48-billion ETF holds a broad basket of over 550 stocks in its portfolio. The fund is up 3.7% so far this year. Transportation – iShares Dow Jones Transportation Average Fund (NYSEARCA: IYT ) This one could be a risky bet as the sector is out of favor right now, having retreated big time from the year-to-date frame (down over 12%). A strong dollar is taking a toll on the profits of big transporters, but other drivers including stepped-up economic activities and cheap fuel are still alive and kicking. This raises optimism on the transportation sector going forward. Actually, transportation stocks gave a havoc performance last year having advanced over 25%. Thus, probably overvaluation was the concern which pushed the space in the bear territory. The current and the next year P/Es for the sector are 13.2 and 12.6 times, a 28.3% and 23.6% discount to the S&P 500, respectively. One way to play this trend is with iShares Dow Jones Transportation Average Fund, which tracks the Dow Jones Transportation Average Index and holds 20 stocks in its basket. The fund has a Zacks ETF Rank #3 (Hold) with a High risk outlook. Original Post
The End Of The 30-Year Bull Market For Bonds: Mitigating Portfolio Risk In A Rising Rate Environment

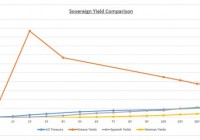
In a rising rate environment an investor should maintain a fixed income allocation, but with caveats. According to history, equities are a good investment option during certain rate hike cycles. Investing in private investments and flexible bond and alternative strategies is a good way to reduce portfolio volatility. The current investment climate presents some unique challenges for investors given the uncertain geopolitical environment, eurozone concerns surrounding Greece, and conflicting monetary policies between the U.S. and much of the rest of the world. Speaking of the latter, investors have been anticipating a rising interest rate environment within the U.S. in accordance with signals from the Fed to likely begin in late 2015. The commencement of quantitative easing (QE) in the eurozone in January and a loose monetary policy in Japan have driven down rates outside of the U.S., making U.S. yields generally more attractive than the rest of the developed world. Please look at chart 1 for interest rate differentials between the U.S. and other sovereign markets. Such a divergence makes little intuitive sense from a credit risk perspective and creates a conundrum for investors. Does an investor buy U.S. yields that are relatively higher yet likely to move even higher, or invest in Europe where the credit might be risky, but appreciation more likely due to QE? Further, how should investors view equities in the context of rising interest rates? Chart 1 (click to enlarge) Source: Bloomberg First, let’s examine the fixed income conundrum. Yes, it is likely that bond investors will experience price declines when the Fed begins the next rate hike cycle. Despite this risk, we argue that conservative investors should maintain some exposure to U.S. dollar denominated high-quality fixed income investments since these vehicles tend to weather market volatility well when investors are fearful; remember negative T-bill yields during the 2008 financial crisis! The aforementioned yield differentials should make the decision to move money to U.S. Treasuries much easier in such a scenario, but ideally investors should hold these positions via separate accounts, individual holdings, or through high-quality, short- to intermediate-term bond funds and ETFs. While it is true that separately managed accounts will decline in value like other bonds, investors will experience only paper losses unless sold, and short dated bonds will redeem at par and reinvest at the higher rates. In terms of bond funds and ETFs, using high quality, short-intermediate dated paper should help to control rate risk and to mitigate potential liquidity problems in the event of forced selling to meet redemptions. Turning to equities, it might be instructive to view stock market performance during previous rate hike cycles. First let’s look at correlations between weekly stock returns and interest rate movements, which are shown in chart 2. Going back to 1963, when 10-Year Treasury yields were above 5% and rising, there was generally a negative relationship between yield movements and stock prices. When yields were below 5%, however, an increase in rates was generally associated with rising stocks prices, reflecting a positive economic environment with generally modest inflation, which should be good for overall corporate profitability. Chart 2 (click to enlarge) Comparing today’s environment with previous cycles, we turn to chart 3, which shows the historical impacts of rate increases. While each cycle displays unique characteristics and circumstances, we would argue that the June 2004-July 2006 period was most reflective of today’s environment. We were at artificially low rates after emerging from a crisis, and while inflation in 2004 was higher than it is today, it was still modest by historical standards. Looking at the green line, while the S&P 500 exhibited some volatility along the way, the trend was generally positive during this 2004-2006 period. A key difference between today and 2004-2006, however, is in corporate earnings volatility. While P/E ratios were similar in both periods (in the 18 range), after a six-year bull market the current and future earnings outlook remains much more uncertain and volatile than was the case in 2004-2006. Chart 3 (click to enlarge) Considering the current environment and the comparison to previous rising rate cycles, how should investors adjust their portfolios to enhance returns and mitigate volatility? While there has been a significant shift toward maintaining maximum liquidity after the 2008 financial crisis, we believe investors should consider initiating or increasing exposure to private and/or alternative investments to diversify away from the volatility of public markets (both equity and fixed income) to reduce correlation among asset classes. For those investors choosing to maintain maximum liquidity, consider investing in flexible fixed income or ’40 Act alternative mutual funds focused on absolute return, not market benchmarks. Additionally, despite the likely scenario of rising rates in the U.S., maintain at least some exposure to high-quality U.S. fixed income based on global interest rate differentials and as a portfolio safe haven. Finally, be willing to hold some cash as it will act as both a buffer, as well as a means for replenishing the marginal liquidity given up in the private markets. Disclosure: I/we have no positions in any stocks mentioned, and no plans to initiate any positions within the next 72 hours. (More…) I wrote this article myself, and it expresses my own opinions. I am not receiving compensation for it. I have no business relationship with any company whose stock is mentioned in this article.

Vanguard Extended Market Index ETF Analysis

We love the Vanguard S&P 500 ETF (NYSEARCA: VOO ). We have had this index in our portfolios for decades. The Vanguard Extended Market Index ETF (NYSEARCA: VXF ) is the mate to the Vanguard S&P 500 Index. They are a pair, and we recommend taking them together. The Vanguard Extended Markets ETF follows the S&P Completion Index. To understand this index you must first understand the S&P Total Market Index. This is a comprehensive US market index that includes large, mid, small and micro cap stocks. Take the S&P 500 stocks out of the S&P Total Market Index and you end up with the S&P Completion Index. This is why they are a pair that should not be separated. The S&P Completion Index holds all of the other mid, small and micro cap stocks not included in the S&P 500 Index. Our database of 1,500+ ETFs does not show any ETFs that replicate the S&P Total Market Index. Even if there were a great ETF available, we would still buy the Vanguard S&P 500 ETF combined with the Vanguard Extended Markets ETF. These two ETFs move at different rates, and since we apply Opportunistic Rebalancing to our portfolios, we have found rebalancing benefits from buying these two ETFs. The Vanguard Extended Market ETF has a low internal fee of 0.14 percent. Even better, as discussed in the previous spotlight, the actual total holding costs have been lower at 0.11 percent over the past 12 months. Put these costs into perspective. The average mutual funds charge 1.27 percent and the average ETF charges 0.61 percent. Vanguard is able to achieve the lowest total costs in the business because they are formed like a credit union instead of a bank. Vanguard is owned by the funds themselves and, as a result, is owned by investors in the funds. This is why Vanguard rebates all of the income from lending securities while most companies rebate a much smaller share. There’s a reason turtle doves come in pairs in “The Twelve Days of Christmas.” Much like the turtle dove, if you are going to use the Vanguard S&P 500 ETF, then consider combining this great holding with the Vanguard Extended Market ETF. Share this article with a colleague