Tag Archives: investing ideas

Apple Teaches Another Lesson In ETF Weighting
Summary Apple’s stock price fell in response to disappointing numbers. Due to its large market capitalization, the company’s moves will affect sector ETFs, notably those that track the tech industry. Alternatively, investors can use ETFs that track equal-weight methodologies to diminish the effect AAPL has on a tech sector investment. By Todd Shriber & Tom Lydon Shares of Apple (NASDAQ: AAPL ) fell 4.3% Wednesday, and at one point during the session, the iPhone maker was lighter by $60 billion in market value, after the company “disappointed” Wall Street by reporting that fiscal third-quarter profit rose “slightly” to $10.7 billion from $7.74 billion on revenue of “just” $49.61 billion. Apple’s Wednesday woes are, predictably, having a dour effect on the exchange traded funds that feature heavy allocations to the iPad maker. For example, the Technology Select Sector SPDR ETF (NYSEARCA: XLK ), the largest technology ETF by assets, has an almost 18% weight to Apple, enough to have the fund trading lower by 1.5% today. XLK’s Wednesday decline, and those of rival technology ETFs with significant Apple weights, reminds investors of the potential dangers of owning a fund with large weights to just one or two stocks. “Apple is a top-10 holding in 98 equity ETFs according to S&P Capital IQ. Besides being the largest stock, ETFs tied to the S&P 500 index like Vanguard S&P 500 ETF (NYSEARCA: VOO ) and the Russell 1000 like the iShares Russell 1000 ETF (NYSEARCA: IWB ), the technology giant is more heavily weighted in popular tech-laden products,” according to S&P Capital IQ. The PowerShares QQQ Trust ETF (NASDAQ: QQQ ), the NASDAQ-100 (NDQ) tracking ETF, entered Wednesday with a roughly 14% weight to Apple, enough to send that ETF lower by more than 1%. The $2.9 billion iShares U.S. Technology ETF (NYSEARCA: IYW ) is perhaps the epitome of an “Apple ETF” with a 20.9% weight (as of July 21) to the stock. That big Apple weight was enough to drag IYW lower by almost 2% yesterday. As S&P Capital IQ notes, there are ways to maintain tech sector exposure via ETFs while mitigating Apple or any other single stock risk. The First Trust NASDAQ-100 Equal Weight Index ETF (NASDAQ: QQEW ) and the Direxion NASDAQ-100 Equal Weighted Index Shares ETF (NYSEARCA: QQQE ) are equal-weight alternatives to QQQ. No stock accounts for more than 1.2% of QQEW’s weight and QQQE had 1% weight to its constituents at the end of the second quarter, according to issuer data . Those ETFs lost about a third of a percent yesterday. The rub is that when Apple performs well, QQQE and QQEW will lag QQQ. Even with Wednesday’s slide, Apple is up more than 13% this year, helping QQQ to a 9% gain, better than double the returns of QQQE and QQEW. The $954.2 million Guggenheim S&P Equal Weight Technology ETF (NYSEARCA: RYT ) has a weight of less than 1.6% to Apple. That is less than the ETF’s weight to Facebook (NASDAQ: FB ), eBay (NASDAQ: EBAY ) and Visa (NYSE: V ). S&P Capital IQ has market weight ratings on QTEW and RYT. Direxion NASDAQ-100 Equal Weighted Index Shares ETF (click to enlarge) Tom Lydon’s clients own shares of Apple, Facebook and QQQ. Disclosure: I am/we are long QQQ, AAPL, FB. (More…) I wrote this article myself, and it expresses my own opinions. I am not receiving compensation for it. I have no business relationship with any company whose stock is mentioned in this article.
Apollo Joins Competitors With New Funds And Plans For Push Into The Retail Market

By DailyAlts Staff Like many of its peers, Apollo Global Management (NYSE: APO ) is focusing on attracting capital from smaller investors. To this end, the firm is teaming with Ivy Investment Management to launch a pair of alternative income mutual funds: The Ivy Apollo Strategic Income Fund and the Ivy Apollo Multi-Asset Income Fund. Both funds will allocate around 20% of their assets to a total return strategy run by Apollo, according to a July 17 SEC filing . The Funds The Ivy Apollo Strategic Income Fund will divide its assets between three strategies: In addition to its total return strategy overseen by Apollo, the fund’s global bond and high-income allocations will be overseen by Ivy, a unit of Waddell & Reed Financial, in the following weights: Total Return Strategy (Apollo): 20% Target Allocation Global Bond Strategy (Ivy): 10%-70% Flexible Allocation High Income Strategy (Ivy): 10%-70% Flexible Allocation The Ivy Apollo Multi-Asset Income Fund, by comparison, is more structured in its allocation and will pursue four distinct investment strategies: Total Return Strategy (Apollo): 20% High Income Strategy (Ivy): 30% Global Equity Income Strategy (Ivy): 40% Global Real Estate Strategy (LaSalle): 10% Apollo’s total return strategy, common to both funds, focuses on high-yield credit. This category leverages Apollo’s skills in the credit markets and includes traditional “junk” bonds, as well as floating-rate bank loans, and mortgage-backed securities. The Strategic Income Fund will carry a management fee of 0.68% while the Multi-Asset Income Fund will charge 0.70% for management fees. Industry Trends Apollo Global Management joins other big money managers, including Blackstone, Carlyle and KKR in making a push into the market for retail alternatives. As quoted in a Bloomberg article , Luke Montgomery, an analyst at Sanford C. Bernstein & Co. in New York, said, “All the firms are focused on the opportunity in liquid alternatives,” and “You hear there is a lot of demand, but the uptake is a little bit slower.” Apollo is picking up the pace. The company’s co-founder Joshua Harris said during its February earnings call that Apollo had established its first sub-advisory relationship with a registered mutual fund: The $6.1 billion Oppenheimer Global Strategic Income Fund. Mr. Harris’s fellow co-founder Leon Black said he’s focusing “more and more” on individual investors, since they have about 1% of their assets allocated to alternatives, compared to as much as 30% for endowments and foundations.

Dividend Growth Stock Overview: Northwest Natural Gas Company

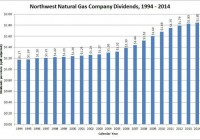
About Northwest Natural Gas Company Northwest Natural Gas Company (NYSE: NWN ) is a natural gas distribution and storage company serving over 705,000 residential, commercial and industrial customers in western Oregon and southwestern Washington. The company and its subsidiaries own and operate 31 billion cubic feet of designed storage capacity in Oregon and California. The company has been in business since 1859, and was incorporated in Oregon in 1910 and began doing business under its current name in 1997. Northwest Natural Gas is headquartered in Portland, OR and employs about 1,000 people. Northwest Natural Gas has two core business segments, the Utility Segment and the Storage Segment. The Utility Segment, which accounts for nearly all of the company’s income, runs the company’s regulated local gas distribution business, which serves over 100 cities in 18 counties with an estimated total population of 3.5 million. The segment receives about 66% of the needed gas supplies from Alberta and British Columbia provinces in Canada and the rest from the U. S. Rocky Mountain region. Segment revenues are driven by the rates determined by the regulatory authorities and by the volume of gas delivered. The volume of gas delivered is itself driven by customer growth. In 2013 and 2014, the company saw customer growth of 1.3% and 1.4%, respectively. The segment earned $2.15 per share in 2014. The Storage Segment provides gas storage services for utilities, large industrial users, electric power companies and other customers. The company signs agreements with customers of varying durations. Most service agreements range from 1-10 years, but some can last as long as 28 years. Segment revenue is driven by increased demand and, in the case of California-based storage, state renewable portfolio standards and carbon reduction targets. The segment lost a penny per share due to the reduction of revenues from the renegotiation of storage contracts that expired in 2014. In addition to the two segments noted above, the company also earned a small amount of money from the sales of appliances from the company’s store. This contributed 2 cents per share to 2014 earnings. In 2014, Northwest Natural Gas earned $58.7 million on $754.0 million of revenue. Net income was down 3% on slightly lower revenues as compared to 2013. Earnings per share were $2.16, down 3.6% from 2013. Based on this and given the annualized dividend rate of $1.86, Northwest Natural Gas has a payout ratio of 86.1%. As mentioned above, the Utility Segment saw earnings growth from customer growth and rate increases, which was offset from lower earnings from the Storage Segment. In the 1st quarter of 2015, Northwest Natural Gas earned $1.37, down from $1.40 in the same quarter in 2014. The decrease was exclusively due to a $9.1 million after-tax charge from a regulatory environmental disallowance. Northwest Natural Gas had a share repurchase program that expired in May 2015. As part of this program, 2.1 million shares had been repurchased since 2000 at a total cost of $83.3 million. The company has not announced a new share repurchase program. The company is a member of the S&P Small Cap 600 and Russell 2000 indices and trades under the ticker symbol NWN. As of mid-July, NWN stock yielded 4.2%. Northwest Natural Gas Company’s Dividend and Stock Split History (click to enlarge) Northwest Natural Gas has compounded dividends at 3.6% over the 10 years ending in 2014. With a dividend growth record that dates back to 1956, Northwest Natural Gas has one of the longest records of year-over-year dividend growth among all publicly traded companies. The company announces annual dividend increases in early October and schedules the stock to go ex-dividend at the end of October. I expect the company to announce its 60th year of dividend growth in October 2015. Like most utilities, Northwest Natural Gas generally grows its payout slowly, with year-over-year increases between 0.5% and 5.5%. From 2009-2014, the company compounded dividends at 2.89%; for the 10 and 20 years ending in 2014, the dividend growth rate is 3.56% and 2.29%, respectively. Northwest Natural Gas has split its stock once in the last 20 years – a 3-for-2 split in September 1996. Over the 5 years ending on December 31, 2014, Northwest Natural Gas stock appreciated at an annualized rate of 6.11%, from a split-adjusted $36.41 to $48.97. This significantly underperformed the 13.0% annualized return of the S&P 500 index, the 15.9% annualized return of the S&P Small Cap 600 index, and the 14.0% compounded return of the Russell 2000 Small Cap index over the same period. Northwest Natural Gas Company’s Direct Purchase and Dividend Reinvestment Plans Northwest Natural Gas has both direct purchase and dividend reinvestment plans. You do not need to be an investor in Northwest Natural Gas to participate in the plans. As a new investor, your initial investment must be at least $250. Subsequent direct investments have a minimum requirement of $25. The dividend reinvestment plan permits you to reinvest all or some of your dividends. The fee structures of the plans are favorable to investors, as Northwest Natural Gas picks up the costs of stock purchases directly from the company. (Stock purchases made on the open market are subject to brokerage commissions.) When you sell your shares, you’ll pay a transaction fee of $15 and the associated brokerage fees, which will be deducted from the sales proceeds. Helpful Links Northwest Natural Gas Company’s Investor Relations Website Current quote and financial summary for Northwest Natural Gas ( finviz.com ) Information on the direct purchase and dividend reinvestment plans for Northwest Natural Gas Disclosure: I do not currently have, nor do I plan to take positions in NWN