Tag Archives: investing ideas

Best And Worst Q3’15: Utilities ETFs, Mutual Funds And Key Holdings
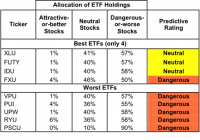
Summary Utilities sector ranks eighth in Q3’15. Based on an aggregation of ratings of nine ETFs and 26 mutual funds. XLU is the top-rated Utilities ETF and EVUYX is the top-rated Utilities mutual fund. The Utilities sector ranks eighth out of the 10 sectors as detailed in our Q3’15 Sector Ratings for ETFs and Mutual Funds report. It gets our Dangerous rating, which is based on an aggregation of ratings of nine ETFs and 26 mutual funds in the Utilities sector. See a recap of our Q2’15 Sector Ratings here. Figure 1 ranks from best to worst all nine Utilities ETFs and Figure 2 shows the five best and worst-rated Utilities mutual funds. Not all Utilities sector ETFs and mutual funds are created the same. The number of holdings varies widely (from 20 to 81). This variation creates drastically different investment implications and, therefore, ratings. Investors should not buy any Utilities ETFs or mutual funds because none get an Attractive-or-better rating. If you must have exposure to this sector, you should buy a basket of Attractive-or-better rated stocks and avoid paying undeserved fund fees. Active management has a long history of not paying off. Figure 1: ETFs with the Best & Worst Ratings – Top 5 (click to enlarge) * Best ETFs exclude ETFs with TNAs less than $100 million for inadequate liquidity. Sources: New Constructs, LLC and company filings Figure 2: Mutual Funds with the Best & Worst Ratings – Top 5 (click to enlarge) * Best mutual funds exclude funds with TNAs less than $100 million for inadequate liquidity. Sources: New Constructs, LLC and company filings The Utilities Select Sector SPDR ETF (NYSEARCA: XLU ) is the top-rated Utilities ETF and the Wells Fargo Advantage Utility & Telecommunications Fund (MUTF: EVUYX ) is the top-rated Utilities mutual fund. Both earn a Neutral rating. The PowerShares S&P SmallCap Utilities Portfolio ETF (NASDAQ: PSCU ) is the worst-rated Utilities ETF and the Rydex Utilities Fund (MUTF: RYUTX ) is the worst-rated Utilities mutual fund. PSCU earns a Dangerous rating and RYUTX earns a Very Dangerous rating. 80 stocks of the 3000+ we cover are classified as Utilities stocks, but due to style drift, Utilities ETFs and mutual funds hold 81 stocks. SCANA Corporation (NYSE: SCG ) is one of our favorite stocks held by Utilities ETF and mutual funds and earns our Attractive rating. Since 2010, the company has grown after-tax profit ( NOPAT ) by 6% compounded annually. This profit growth is supported by SCANA’s 16% NOPAT margin, which is much higher than the 12% achieved in 2010. Despite SCANA’s steady business improvements, the stock price reflects a different picture. At its current price of ~$56/share, SCANA has a price to economic book value ( PEBV ) ratio of 0.9. This ratio implies that the market expects the company’s profits to permanently decline by 10%. If SCANA can grow NOPAT by only 4% compounded annually over the next five years , the stock is worth $72/share today – a 28% upside. Northwest Natural Gas Company (NYSE: NWN ) is one of our least favorite stocks held by Utilities ETF and mutual funds and earns our Dangerous rating. Over the past five years, Northwest’s NOPAT has declined by 3% compounded annually. Northwest currently earns a bottom quintile return on invested capital ( ROIC ) of 3%. Despite the declining profits, investors have stuck with NWN, most likely for its 4% dividend yield. However, dividend aside, Northwest’s stock price is overvalued. To justify its current price of $44/share, Northwest must grow NOPAT by 4% compounded annually for 12 years . 4% NOPAT growth might not seem like much, but for a Utility company that has seen profits decline for years, this growth expectation is rather optimistic. Figures 3 and 4 show the rating landscape of all Utilities ETFs and mutual funds. Figure 3: Separating the Best ETFs From the Worst ETFs (click to enlarge) Sources: New Constructs, LLC and company filings Figure 4: Separating the Best Mutual Funds From the Worst Mutual Funds (click to enlarge) Sources: New Constructs, LLC and company filings D isclosure: David Trainer, Kyle Guske II, and Max Lee receive no compensation to write about any specific stock, sector or theme. Disclosure: I/we have no positions in any stocks mentioned, and no plans to initiate any positions within the next 72 hours. (More…) I wrote this article myself, and it expresses my own opinions. I am not receiving compensation for it. I have no business relationship with any company whose stock is mentioned in this article.
Revisiting The 100 Stocks With The Lowest Volatility In S&P 500 Index

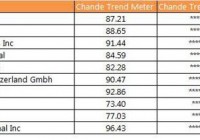
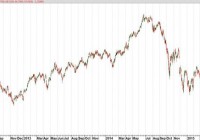
Summary We expand the discussion from a recent Editor’s Pick on building portfolios with the lowest volatility stocks in the S&P 500 Index. We point out that high beta is not necessarily high momentum and discuss why low volatility stocks might provide stronger performance. We simulate the portfolio construction calculations behind the S&P 500 Low Volatility Index and construct the current Top-10 portfolio holdings. We re-rank the lowest volatility stocks by momentum metrics to find stocks trending higher even in the current choppy market conditions. Introduction In a recent Editor’s Pick , Ploutos discussed the relative merits of using low volatility and high beta funds to generate better returns than the SPX (Ref 1). He combined the PowerShares S&P 500 Low Volatility Portfolio (NYSEARCA: SPLV ) and the PowerShares S&P 500 High Beta portfolio (NYSEARCA: SPHB ) to improve returns. His analysis is open to two criticisms. First, he was using a high beta portfolio as a substitute for a momentum strategy. However, high beta does not necessarily mean high momentum. Naturally, these terms are not cast in stone, and differences in calculation methodology and time period of data used in the analysis can change the measured beta as well as calculated momentum. So, for example, a fund like the PowerShares DWA Momentum Portfolio (NYSEARCA: PDP ) could be substituted for the SPHB portfolio. Second, he does not discuss why a stock may have low volatility, why a group of 100 stocks with the lowest volatility had returns greater than the full 500-strong index, and why this outperformance should persist for years on end. Thus, it is theoretically possible to go through a prolonged period during which the 100 stocks with the lowest volatility as a group do not consistently outperform the full index or their high-beta cousins quarter after quarter, and two groups flip flop back and forth negating any benefit of switching from one group to another. Why do stocks have low volatility? There are many reasons a stock could have low volatility. A stock may have low volatility because it has slow earnings growth and does not have the price amplitude, volume and spreads to catch the fancy of short-term traders. The stock may have large institutional ownership, and any dip in the stock leads to greater accumulation by institutions, so that large drops are rare. The earnings could be highly predictable and consistent, so the stock does not produce either positive or negative earnings surprises. The stock could have a large dividend payout, so it trades more like a bond than a stock. The stock could have gone through a period of very high volatility, that has shaken “weak longs” out of the stock, and volatility has diminished as the stock goes through a consolidation. A stock may be viewed as having a conservative management with high cash-flow, slow-growth businesses, that are not sensitive to strength or weakness in the economy. Hence, low volatility could be proxy for slow growth, high cash generators with large institutional ownership that are perceived as “low risk” investments. Thus, the exact reasons that a stock has low volatility over a given period and its implications for price advancement over the immediate future are unclear. Also, there could be numerous other reasons for low volatility in a stock. Why do low volatility stocks outperform the full index? In the ideal scenario, a stock has low volatility, is accumulated, and volatility increases due to favorable developments in the stock, such as improved growth prospects, and the stock breaks out into a strong trend. For example, management could focus on cutting costs and buying other companies with higher-margin products in the same sector. Thus, trading low volatility becomes a counter-trend entry into a stock that will morph into a growth story in the future. In this scenario, this stock starts off as a low volatility entity that shifts gears into a high growth phase, accounting for its outperformance. Of course, it will eventually drop off the 100-lowest volatility list, but then, its substitute will ideally repeat the same pattern. Alternately, the external market environment deteriorates, due to a weak economy or geo-political risks, prospects for price acceleration are murky or confusing, and money comes out of high-beta or high-volatility stocks and rotates into low-volatility stocks, being used as a temporary hedge or defensive position against market worries. These conditions could last for several quarters, and would again account for out-performance versus the full index. Naturally, there could many other possibilities for why low volatility stocks perform better than the index as a whole, such as buy-outs, rising dividends or a prolonged period of very low interest rates. Current State of Play: SPLV ETF As we have discussed above, low volatility does not have to mean low returns, especially when these stocks are used as a bulwark against market uncertainty. We perform a full trend analysis of the top-10 holdings of the PowerShares SPLV ETF (see Figure 1) below. The Top 10 are trending well, with good buying support for CB and BAX in particular. (click to enlarge) Figure 1: The current Top-10 holdings in the SPLV ETF are trending well given all the uncertainty in the market. (Data courtesy ETFmeter.com ) Updated Holdings through August 6 We asked the question: what would the current top 10 look like? We copied the methodology of the index and our updated top-10 holdings are shown in Figure 2. From Figure 1, XL Company (NYSE: XL ) and Stericyle (NASDAQ: SRCL ) are the only two companies in the top 10. One can then argue that an equally weighted portfolio would be better, since the rebalancing would only involve stocks which dropped out of the 100 least volatile stocks group. Figure 2: We update the portfolio weights using data through August 06 and the methodology described by the index provider. Only two of stocks, XL and Stericycle from the current top-10 in the SPLV ETF are on the list. (Data courtesy ETFmeter.com) The Best Trending of the 100 Lowest Volatility Stocks We can now ask the question: which are the best trending of the 100 stocks with the lowest volatility in the S&P 500 index? How are they doing? If money is rotating into low-volatility stocks in the face of market worries, then the 10 best trending stocks out of the 100 stocks with the lowest volatility in the S&P 500 index should be largely defensive stocks with steady earnings. We check this hypothesis in Figure 2 below using data through August, 06 2015. We find that out of the lowest 100 stocks, seventeen stocks seem to be surging, and we show them in Figure 3. The charts are somewhat similar, and we show the charts of Kellogg (NYSE: K ) and Clorox (NYSE: CLX ) to illustrate this idea (see Figures 4 and 5). Figure 3: The 17 stocks with the strongest trends in the 100 stocks with the lowest volatility in the S&P 500 index are a who’s who of defensive stocks. (Data courtesy ETFmeter.com) (click to enlarge) Figure 4: The Kellogg chart is rising strongly during the recent market uncertainty after analyst upgrades. (Chart courtesy StockCharts.com) (click to enlarge) Figure 5: The chart for Clorox looks quite similar to the one in Figure 4, showing the defensive rotation into low volatility stocks. (Chart courtesy StockCharts.com) Summary The low volatility group in the S&P 500 index can offer a respite in the rough seas of a choppy market. There are many alternatives to constructing portfolios with the lowest 100 volatility stocks and combining them with high beta and pure momentum strategies. Disclosure: I/we have no positions in any stocks mentioned, and no plans to initiate any positions within the next 72 hours. (More…) I wrote this article myself, and it expresses my own opinions. I am not receiving compensation for it. I have no business relationship with any company whose stock is mentioned in this article.

Is It Time To Buy Energy CEFs?

Summary Energy CEFs have been hit hard over the past year, resulting in potential bargains. Energy CEFs offer enticing income while you wait for the sector to recover. My picks are PEO and TTP for long term risk-adjusted performance when the bull returns. I am primarily an income investor but I have a contrarian streak and believe in the wisdom of Warren Buffet when he opined: “Be greedy when others are fearful.” This advice has never been truer than now when you consider the total collapse of the energy market. West Texas Intermediate (WTI) oil has plummeted from $104 per barrel in June of last year to less than $50 a barrel today. This has driven down energy stocks to what I consider bargain basement levels. The rapid fall of energy stocks is illustrated by plot of the price of the Energy Select Sector SPDR Exchange Traded Fund (NYSEARCA: XLE ) shown in Figure 1. This ETF is a passive cap-weighted fund that tracks the price of 41 of the largest energy companies. It has an expense ratio of only 0.15% and yields 2.9%. The plot shows that prices peaked in July of last year and has since fallen over 33%. (click to enlarge) Figure 1: Plot of XLE over past 3 years I am not clairvoyant and have no idea how long it will take the energy sector to recover. However, I am confident that over the long run, oil will again return to its glory days. This is based on past history coupled with the number of trouble spots around the world that could disrupt the supply of oil. So I have begun accumulating beaten-down energy stocks. To accomplish this, I am a fan of using Closed End Funds (CEFs) because they are actively managed and offer attractive distributions while you wait for the recovery. There are only four CEFs that focus on energy and have at least a 3 year history. I did not include CEFs that invest primarily in precious metals or master limited partnerships (NYSEARCA: MLPS ). If you are interested in MLPs, please see my article that I recently wrote on Seeking Alpha. The CEFs I included in the analysis are summarized below. Adams Natural Resources (NYSE: PEO ). This CEF was formerly known as Petroleum and Resources and is one of the oldest CEFs, having begun trading on the NYSE in 1929. The fund sells at a discount of 15.2%, which is a slightly larger discount than the 3 year average of 14%. The portfolio consists of 39 companies in the energy and natural resource sectors. It utilized less than 1% leverage and has an expense ratio of 0.6%. The distribution is $0.10 per quarter which is only 2% but it also typically distributes a large capital gain at the end of the year. Last year the capital gain was $1.59, which brought the yearly distribution to $1.99 or almost 10%. None of the distribution was return of capital (NYSE: ROC ). The fund has an exceptional track record and has paid capital gains for 63 consecutive years and dividends for 80 consecutive years. The fund has made a commitment to pay distributions equal to at least 6% of the fund trailing 12 month average price. BlackRock Energy and Resources (NYSE: BGR ). This CEF sells at a discount of 11.4%, which is a larger discount than the 3 year average discount of 7%. This fund is concentrated and has only 30 holdings, all from the energy sector. About 75% of the companies are domiciled in the United States with the rest primarily Canadian and European companies. The fund does not use leverage and has an expense ratio of 0.3%. However, the fund may use options to enhance dividend yield. The distribution has been $0.135 per month but was dropped to $0.11 for August. The fund distributed $1.14 in December of last year. Unfortunately the distributions this year have been mostly return of capital. It is difficult to assess if this is destructive ROC because of the option income plus the fact that the Undistributed Net Investment Income (UNII) is only slightly negative. If readers have more insight, please let me know. First Trust Energy Infrastructure (NYSE: FIF ). This CEF sells at a discount of 15.3%, which is a larger discount than the 3 year average of 7.7%. The portfolio has 70 holdings and focuses on energy infrastructure, with 26% in MLPs and the rest invested in energy companies. About half the holdings are in the pipeline industry and about 24% are associated with electric power. This fund utilizes 25% leverage and has an expense ratio of 1.8%. The distribution is 0.11 per month with capital gains of $1.43 paid last November. Most of the distributions do not rely on ROC and UNII is positive. Tortoise Pipeline and Energy (NYSE: TTP ). This CEF sells for a discount of 15.1%, which is a larger discount than the 3 year average of 8.5%. The portfolio has 60 holdings consisting of 24% MLPs, 65% pipeline corporations, and 10% integrated oil companies. About 30% of the holdings are domiciled in the U.S. The fund utilizes 22% leverage and has an expense ratio of 2.1%. The distribution is 5.3%, consisting of income, capital gains, and a relatively small amount of ROC. The UNII is large and positive, which is a good sign. Voya Natural Resources, Equity (NYSE: IRR ). This CEF sells at a discount of 13.2%, which is a larger discount than the 3-year average discount of 8.6%. The portfolio consists of 84 holdings with 20% from integrated oil companies, 26% from exploration and production companies, and 16% from oil services. About 89% of the holdings are domiciled in the U.S. This fund uses a covered call strategy to enhance returns and does not utilize leverage. The expense ratio is 1.2%. The distribution a huge 15.7%, consisting primarily of short term gains. The fund has not used ROC over the past year and the UNII is positive. To assess the performance of the selected CEFs, I plotted the annualized rate of return in excess of the risk free rate (called Excess Mu in the charts) versus the volatility of each of the component funds over the past 3 years. The risk free rate was set at 0% so that performance could be easily assessed. This plot is shown in Figure 2. Note that the rate of return is based on price, not Net Asset Value (NYSE: NAV ). (click to enlarge) Figure 2. Risk versus reward over the past 3 years. The plot illustrates that the CEFs have booked a wide range of returns and volatilities over the past 3 years. To better assess the relative performance of these funds, I calculated the Sharpe Ratio. The Sharpe Ratio is a metric, developed by Nobel laureate William Sharpe that measures risk-adjusted performance. It is calculated as the ratio of the excess return over the volatility. This reward-to-risk ratio (assuming that risk is measured by volatility) is a good way to compare peers to assess if higher returns are due to superior investment performance or from taking additional risk. In Figure 2, I plotted a red line that represents the Sharpe Ratio associated with XLE. If an asset is above the line, it has a higher Sharpe Ratio than XLE. Conversely, if an asset is below the line, the reward-to-risk is worse than XLE. Note also that Sharpe Ratios are not meaningful if a stock has a negative return. Some interesting observations are evident from the figure. The energy CEFs exhibited a relative tight range of volatilities that were similar to XLE. This was somewhat surprising since I expected CEFs to have higher risks than the passive XLE (because the CEFs are actively managed and some use leverage which could increase volatility). Overall, as expected, energy funds did have great performance over the period. The funds that focused on energy production and exploration fared the worst while the infrastructure funds (FIF and TTP) performed the best. The funds that utilized an option strategy (BGR and IRR) were the worst performers. On both an absolute basis and a risk-adjusted basis, TTP and FIF outperformed XLE. PEO had about the same risk-adjusted performance as XLE but both only managed to eke out a small positive total return. PEO was the least volatile of the group. Since all the funds were associated with natural resources, I wanted to assess how much diversification you might receive by buying multiple funds. To be “diversified,” you want to choose assets such that when some assets are down, others are up. In mathematical terms, you want to select assets that are uncorrelated (or at least not highly correlated) with each other. I calculated the pair-wise correlations associated with the funds. The results are presented in Figure 3. Figure 3. Correlation over the past 3 years The figure presents what is called a correlation matrix. The symbols for the funds are listed in the first column on the left side of the figure. The symbols are also listed along the first row at the top. The number in the intersection of the row and column is the correlation between the two assets. For example, if you follow TTP to the right for three columns you will see that the intersection with IRR is 0.413. This indicates that, over the past 3 years, TTP and IRR were only 41% correlated. Note that all assets are 100% correlated with themselves so the values along the diagonal of the matrix are all ones. As shown in the figure, BGR and PEO were highly correlated with XLE. Thus, you do not receive substantial diversification benefits by purchasing more than one of these funds. On the other hand, FIF, IRR, and TTP were not highly correlated with each other or XLE. Thus, the funds would provide good diversification if you already own PEO or XLE. The 3 year look-back data shows how these funds have performed in the past. However, the real question is how they will perform in the future when the bull market in energy returns. Of course, no one knows but we can obtain some insight by looking at the most recent bull market period from July, 2012 to July, 2014. As shown in Figure 1, this was a great period for energy firms. Figure 4 plots the risk versus reward for the funds over this bull market time frame. As expected, all the funds did well and most (with the exception of IRR and FIF) had about the same risk-adjusted performance. Both IRR and FIF lagged during the bull market but TTP was the best performer. (click to enlarge) Figure 4. Risk versus reward during a bull market Bottom Line Energy CEFs are selling at large discounts and if you believe the bull market in energy will return over the near term, you should consider investing in CEFs. I would recommend PEO and TTP. PEO has a great long term record and I like it better than XLE. I would also consider adding TTP, which is relatively uncorrelated with PEO and did exceedingly well during the last bull market. Both of these funds offer good diversification and income while you wait for the bull to return. Disclosure: I am/we are long PEO, TTP. (More…) I wrote this article myself, and it expresses my own opinions. I am not receiving compensation for it (other than from Seeking Alpha). I have no business relationship with any company whose stock is mentioned in this article.